Download
1 / 39
420 likes | 648 Views
3 - Stellar Spectra. Why a slit?. No slit. Slit. Sky Backgrounds and Telescope Nods. star slit. Visual & Photographic & 2D Electronic Detectors. 1D or “ Compressed ” 2D Electronic Detectors. Catalog Names. Increasing T. ...also collisions with electrons. Balmer Series & Balmer Jump.

E N D
Why a slit? No slit Slit
Sky Backgrounds and Telescope Nods star slit
Visual & Photographic & 2D Electronic Detectors 1D or “Compressed” 2D Electronic Detectors
Catalog Names Increasing T
Balmer Series & Balmer Jump IR Visual! UV
BLUE part of the visual spectrum.... Old Photographic NEGATIVES that Defined Spectral Classification
Pressure Broadening & Pressure Ionization (Energy Level Perturbation & Changing Recombination Rate)
Modern Digital Spectra (from Silva & Cornell 1992, ApJS, 81, 865)
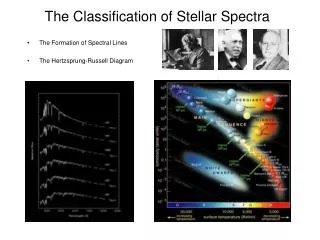
Originally, classification was based on spectra at visible wavelengths, since that’s all that was available at the time!
Luminosity Classes Log L V = Main Sequence T
Measuring Stars at Different λs – “Alphabet Soup Photometry” - UBVRIJHKLMNQ “Standard” Johnson System (and newer Bessell Cousins-Kron filters) Filter λeff(μm) Δλ(μm) U 0.36 0.07 B 0.44 0.10 V 0.55 0.09 RCK 0.64 0.16 R 0.70 0.22 ICK 0.80 0.15 I 0.90 0.24 J 1.25 0.23 H 1.65 0.29 K 2.2 0.42 L 3.5 0.57 M 4.6 0.34 N 10 6 Q 19 5 edge originally set by detector – now by filter
K J H L M
Photometry & Stellar Magnitudes where const(λ) is set by the photometric system Relative brightnesses of 2 stars at a given λ:
For a collection of stars at the same distance from us, and T versus L diagram translates into a Color-Magnitude diagram. The magnitude can be either M or m without destroying this correspondence.
Beyond OBAFGKM S Stars - dominated by ZrO C/O~1, sometimes Tc present! (99Tc has half-life of 2.1x10⁵ yrs)
Carbon Stars C/O >1 R - C/O > 1 bands of C2, C3, CH, CN, etc. N - C/O > 1 and s-process elements like Ba & Sr CH - Old stars with stronger CH
Brown Dwarf Spectral Classes M - Above 2000 K, TiO and VO dominate T=2000-2200 K, TiO condenses into solids CaTiO3 in M, Ti3O5 & Ti2O3 in cooler objects L (“new”!) - TiO and VO gone T (“new”!) - CH4 appears in “H” and “K” photometric bands (actually in “L” at M5, in “K” at L8, and in “H” at T0 - “The Goldilocks Problem”) Y (discovered in 2012)– NH3 (H2O??)
Exoplanet “Spectra” HD189733b Hubble Data Swain et al. 2008