Download
1 / 18
180 likes | 201 Views
Dive into the scientific method with this comprehensive guide on conducting experiments step by step, from formulating hypotheses to analyzing results and drawing conclusions.

E N D
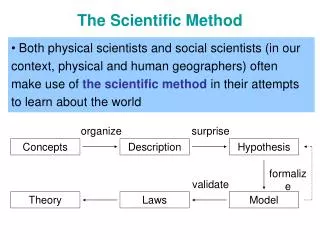
The Scientific Method a series of steps that is used to answer a question or solve a problem
Step I – _______________________________Questions arise from observations of the world around you.The purpose of your experiment is to try and find an answer to your question Ask a question or state your purpose Can people tell the difference between Coke and Pepsi? Where do mosquitoes go in the winter? Why is the sky blue? What dogfood does my dog like the best?
Example: The purpose of this experiment is to find out whether response time varies with age.
Background Research Step II – ____________________________ Find out information on your topic. What is already known about your problem? What do you already know about your topic?
What are some places to go to find this information? ________________ , ________________, ________________ ,________________, ________________ , ________________ library internet museums zoo ask an expert encyclopedia
Example: What do you know already about what affects reaction time? ________________________________________
Make a hypothesis Step III – ____________________ A hypothesis is an educated guess that explains your observation or answers your question. A hypothesis must be testable. Hypotheses are written in an “If….then…because…” format. Example: If test the response times of people at different ages then I think that people between the ages of 30-40 will have the quickest response time because they have a lot of experience and haven’t slowed down very much yet.
Experiment Step IV – ___________________________ Scientists design controlled experiments to test their hypotheses. A controlled experiment tests only one thing or factor at a time. There are many other things or factors that could affect the outcome of the experiment. But, only one factor is allowed to change during the experiment. A scientist then measures the effect of that one factor. All of these factors, the ones that change and the ones that don’t, are called variables.
independent variable: the variable that is changed by the scientist. There is only one per experiment. • dependent variable: the variable that changes in response to the independent variable. It is what you are measuring. There can be more than one dependent variable per experiment. • controlled variables: the variables that must not change during your experiment. There is usually more than one variable that needs to be controlled in an experiment.
So, what are the variables in my experiment? independent variable: __________________ dependent variable(s): _________________ controlled variable(s):__________________ age of person response time type of test, time of day, where tested
Materials: ______________ ______________ ______________ ______________ ______________ ______________
Procedure: A procedure is written as a list, not as a paragraph. Provide complete, step-by-step instructions. Do not use personal pronouns; always use commands. 1. ___________________________________ 2. ___________________________________ 3. ___________________________________ 4. ___________________________________ 5. ___________________________________ 6. ___________________________________ 7. ___________________________________ 8. ___________________________________ 9. ___________________________________ 10. ___________________________________
Results Step V – ____________________ Make a table or chart to collect your data. Write down any observations or measurements in your chart. When you are done your experiment, make a graph of your data. What are the different types of graphs you can use to represent data? _____________,_____________,_____________ bar graph pie chart line graph
Conclusions Step VI – _______________________ There are several parts to the conclusion. 1st: Restate your purpose and hypothesis. You may abbreviate your hypothesis. Example: The purpose of this experiment was to find out whether response time varies with age.I thought that people between the ages of 30-40 would have the fastest response time.
2nd: Decide whether your results supported your hypothesis. Give supporting data. Example: My hypothesis was not supported. People between the ages of 20-30 had the fastest response times. The average response time for this group was 5.4 seconds, 2.1 seconds faster than any other group.
3rd: Include the significance of your results. Example:My results suggest that young people improve their response times as they grow up but that response times start to decline after age 30.
4th: What would you do differently if you could do this experiment over again? Why would you choose to do this? Example: Next time I am going to test whether response time is affected by the time of day. I want to see whether people react more quickly in the morning, in the afternoon or in the evening. This could be important for scheduling sporting events or planning when to do work that requires quick reflexes.