Download
1 / 35
360 likes | 982 Views
Visual Illusions. Kevin Ko and Ariana López July 23, 2004 COSMOS 2004, UC Santa Cruz Cluster 7. Overview. Ponzo Illusion – Kevin Ko Muller-Lyer Illusion – Ariana López Conclusion. The Ponzo Illusion. Kevin Ko. Background Information.

E N D
Visual Illusions Kevin Ko and Ariana López July 23, 2004 COSMOS 2004, UC Santa Cruz Cluster 7
Overview • Ponzo Illusion – Kevin Ko • Muller-Lyer Illusion – Ariana López • Conclusion
The Ponzo Illusion Kevin Ko
Background Information • First proposed by Mario Ponzo (1880 – 1960) in 1913-Italian scientist
The Experiment What is Ponzo Illusion? Task: to match the length of the test bar with the reference bar Ratio: Test bar length/Ref. bar length
The Experiment The Sampling Process • 10 subjects participated-7 females, 3 males-ages between 15 to 26 years old Goal • To use the sample to make inferences of the general population about their perception (2D vs. 3D).
Data Results/Data Analysis • Calculated individuals’ ratio for each trial • Averaged all individuals’ ratios • Average of all individuals’ averages • Calculated standard Error /(n^0.5) Ratio = test bar length / ref. bar length
Experiment 1 Variables – Angle of Tracks • H1: It is easier to match the lengths of the bars if the angle of the track is smaller. Angle = 10º Angle = 17º Angle = 22º
Theories • As the angle of the track decreased, the perceived distance effect decreased.
Results – Angle of Tracks • The actual data did not support the 1st hypothesis. • The data implied that the visual effect reached its maximum at 17º. Confirmed significance with t-test (p 10º and 17º = 0.022094 and p 17º and 22º = 0.003685)
Experiment 2 Variables – Orientation of the bars • H2: It is harder to match the lengths of the bars if both bars are vertically-oriented. Vertical Horizontal
Theories • Individual’s visual perception of 2D vs. 3D affected the outcome.
Results – Vertical vs Horizontal bars • The data did not support the 2nd hypothesis as well. • The data implied that the subjects tended to do better when the bars were vertically-oriented. Confirmed significance with t-test (p horizontal and vertical bars =0.017524)
Experiment 3 Variables -Reference bar positions with respect to the vanishing point • H3: It is easier to match the lengths of the bars if both bars are held closer together. Bar at 70 Bar at 120 Bar at 100
Theories • The closer the reference bar was to the horizon, the smaller the reference bar should appear.
Result – Physical distance between bars • The actual data did not support the 3rd hypothesis. • The data implied that the physical distance between the two bars did not affect the results. Confirmed significance with t-test (p bar 70 and bar 100 = 0.442203 and p bar 100 and 120 = 0.474678).
Conclusion What was happening? • The number of ties was changed along with the angle. • Mystery Spot in Santa Cruz-studies show visual illusion reaches its maximum effect between 15 and 20º.-Angle test 17º • A few subjects changed the way they perceived objects during the test (from 2D to 3D or vice versa) • Lesson: actual data don’t always support the hypothesis-by chance?-flaws in experiment? • -we don’t really understand perception
The Moon Illusion • Scientists now apply this concept to the Moon
Thank you! Thank You!
Müller-Lyer Illusion Ariana López
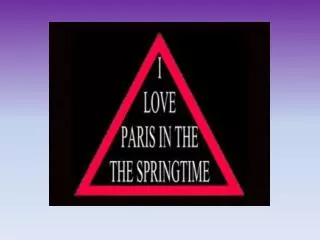
What is the Müller-Lyer Illusion? • Proposed by German psychiatrist Franz Müller-Lyer in 1889. • It has been tested throughout the 20th Century. • (1966) illusion may be absent or reduced amongst people who grow up in certain environments. Which line is longer?
Why study Müller-Lyer Illusion? • To find the connection between sight and the brain. • To find out why people relate pictures to something more familiar. • To find out how society and environment affect perception. • To find out why people perceive this illusion in very different ways.
What was the procedure? • I tested 11 people. • Subjects were asked to change the length of the central line three times until they thought they were equal. • I averaged the results from each subject.
Variable A: Color of central line • Hypothesis: • It would be easier for the subject to get the right length by focusing on only one color rather than both.
Variable A: Color of the central line • There was no evidence to support my hypothesis. • For some people the illusion was very strong, and for some it was very weak. • The change of color did not make a big difference.
Theories and Explanations • Corner Theory • Gestalt Principles - Closure - Area and Symmetry
Conclusion for variable A • Color did not affect the Corner Theory. • If you have walls painted different colors, you would still see the same corner. • Color did not affect the Area Principle. • No matter what color the central line is, the area of the enclosed figure would still be the same.
Variable B: Fins vs. Ellipses • Hypothesis: • People might have more difficulty focusing on the length of the bars with the ellipses. • Illusion might be stronger for ellipses.
Variable B: Fins vs. Ellipses • There was evidence to prove my hypothesis right. • Both averages were about the same, but data for ellipses was more spread out.
Conclusion for Variable B • There was evidence against Corner Theory. • If Corner Theory was the only explanation for the Müller-Lyer Illusion, then there would not appear to be a difference in length for the lines with the ellipses. • The Closure Principle and the Area and Symmetry Principle do explain my experimental results.
Variable C: Length of Fins Hypothesis: The longer the fins, the stronger illusion.
Variable C: Length of Fins • There was evidence to prove my hypothesis right. • Average ratio increased as length of fins increased. • Error bars did not significantly overlap.
Conclusion for Variable C • Corner Theory did work because the longer the fins, the easier to relate the figure to a corner. • Closure Principle and Area and Symmetry Principle worked because the longer the fins, the bigger the difference in area of the enclosed figures.
Conclusions • We studied the Müller-Lyer Illusion to try to understand how the eye and the brain interact. • We changed the color of the central line, fins vs. ellipses and the length of the fins. • The change in color did not affect the Corner Theory and the Area Principle. • Corner Theory does not fully explain the Müller-Lyer Illusion. • Closure, Area and Symmetry Principles work.
Acknowledgements • Center for Adaptive Optics-Sally Robinson, Advisor-David Lai, Advisor-Jason Porter, Advisor-Scott Seagroves, Instructor-Scott Severson, Instructor • COSMOS-Gary Martindale, Teacher Fellow-Malika Moutawakkil, Coordinator • DoggHouse 7 (woof, woof, you know!) • All RAs, SRAs, and Daniel Jackson • Kenee Houser, Program Coordinator COSMOS 2004, UC Santa Cruz