Download
1 / 9
90 likes | 174 Views
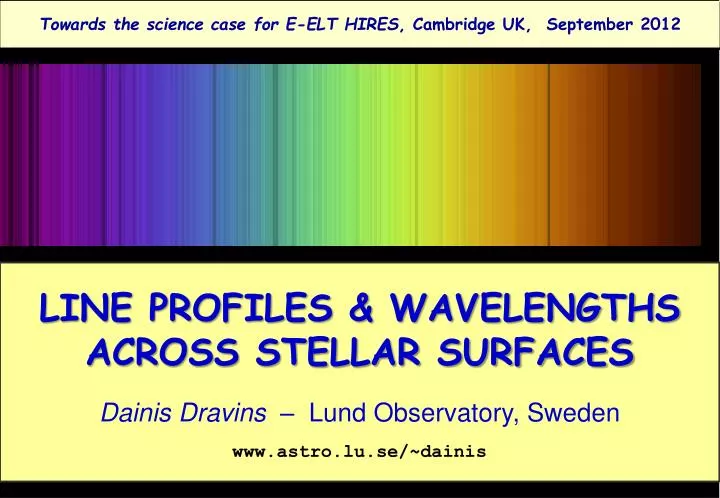
Towards the science case for E-ELT HIRES , Cambridge UK, September 2012. KVA. LINE PROFILES & WAVELENGTHS ACROSS STELLAR SURFACES Dainis Dravins – Lund Observatory , Sweden www.astro.lu.se /~ dainis. STELLAR SURFACES … where starlight and stellar spectra originate.

E N D
Towards the science case for E-ELT HIRES, Cambridge UK, September 2012 KVA LINE PROFILES & WAVELENGTHS ACROSS STELLAR SURFACES Dainis Dravins – Lund Observatory, Sweden www.astro.lu.se/~dainis
STELLAR SURFACES … where starlight and stellar spectra originate Simulations feasible for widely different stars But … any precise physical conclusion depends on the reliability of modeling (metallicity, magnetic activity, gravitational redshift, center-to-limb wavelength changes). How does one verify/falsify 3-D simulations (except for the spatially resolved Sun) ? High-resolution spectroscopy across spatially resolved stellar disks! Granulation on a 12,000 K white dwarf (top) and a 3,800 K red giant. Areas differ by enormous factors: 7x7 km2 for the white dwarf, and 23x23 RSun2 for the giant. (H.-G. Ludwig, Heidelberg)
LINE PROFILES FROM 3-D HYDRODYNAMIC SIMULATIONS Model predictions insensitive to modest spatial smearing Spatially averaged line profiles from 20 timesteps, and temporal averages. = 620 nm = 3 eV 5 line strengths GIANT STAR Teff= 5000 K log g [cgs] = 2.5 (approx. K0 III) Stellar disk center; µ = cos = 1.0 (Models by Hans-Günter Ludwig, LandessternwarteHeidelberg)
(1) Spatially resolved spectroscopy with E-ELT Requires adaptive optics with integral-field unit Left: Hydrodynamic simulation of the supergiant Betelgeuse (B.Freytag) Right: Betelgeuse imaged with ESO’s 8.2 m VLT (Kervella et al., A&A, 504, 115) Top right: 40-m E-ELT diffraction limits at 550 nm & 1.04 μm. Figure by Hiva Pazira (Lund Observatory)
(2) Selecting portions of stellar disk during exoplanet transits Requires very high S/N in high-resolution spectrometers Figure by Hiva Pazira (Lund Observatory)
Towards the science case for E-ELT HIRES, Cambridge UK, September 2012 KVA HIRES quasar spectrum (A.S.Cowie, Univ.ofHawaii) WAVELENGTH SHIFTS OF INTERGALACTIC ABSORPTION LINES Dainis Dravins – Lund Observatory, Sweden www.astro.lu.se/~dainis
WHENEVER SPECTRAL LINES DO NOT ORIGINATE IN ISOTROPIC TURBULENCE, WAVELENGTH SHIFTS RESULT Observed solar granulation (Swedish Solar Telescope on La Palma; G.Scharmer& M.G.Löfdahl) SOLAR MODEL Synthetic line profiles showing convective wavelength shifts originating in granulation = 620 nm; = 1, 3, 5 eV; 5 line strengths Teff= 5700 K; log g [cgs] = 4.4; G2 V Solar disk center; µ = cos = 1.0 (Models by Hans-Günter Ludwig, Landessternwarte Heidelberg)
WHENEVER SPECTRAL LINES DO NOT ORIGINATE IN ISOTROPIC TURBULENCE, WAVELENGTH SHIFTS RESULT … AND THE SAME MUST APPLY TO ALSO INTERGALACTIC CONVECTION, DRIVEN BY HEATING BY AGNs NEAR CLUSTER CENTERS (Eveniftimescalesmight be 100 Myr, ratherthan solar 10 minutes) Perseus cluster core in X-rays (Chandra), overlaid with Hα (WYIN). Arc-shaped Hα filaments suggest vortex-like flows. Density slices at three times. Viscosity stabilizes the bubble, allowing a flattened buoyant “cap” to form. X-ray brightness and inferred velocity field in Per-A can be reproduced. (Reynolds et al.: Buoyant radio-lobes in a viscous intracluster medium, MNRAS 357, 242, 2005)
INTERGALACTIC LINE ASYMMETRIES AND SHIFTS: ANALOGIES AND DIFFERENCES TO STELLAR CONVECTION: • Plausible amount: 1% of “general” line broadening = 0.5–1 km/s? • Mapping 3-D structure from different shifts in different lines! • Need line synthesis from 3-D hydrodynamic models! • Lines closer to cluster centers gravitationally more redshifted • Mapping depth structure from multiple line components? • Probably useful to have resolving power approaching 1,000,000?? • Resolving lateral structure from secular time changes???