Download
1 / 17
170 likes | 272 Views
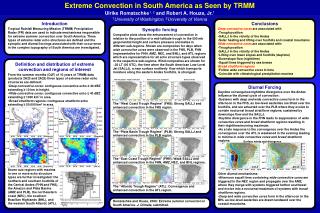
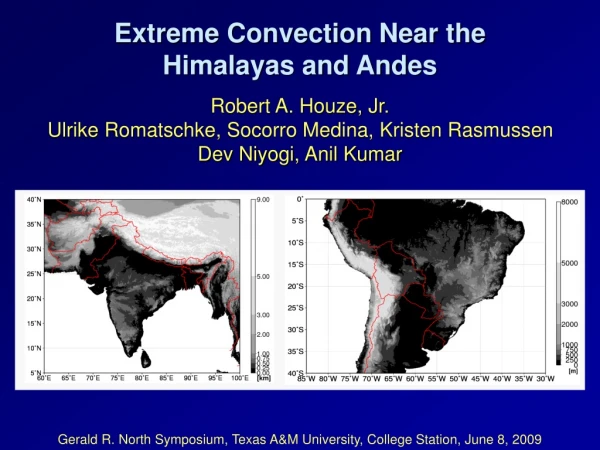
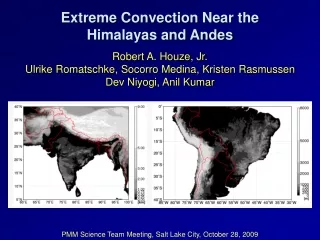
Extreme Convection in the Equatorial Zone as Seen by 16 Years of TRMM PR. M. D. Zuluaga and R. A. Houze, Jr. University of Washington. PMM Science Team Meeting, Baltimore, 7 August 2014. Use TRMM to find the most pronounced convective & stratiform elements.

E N D
Extreme Convection in the Equatorial Zone as Seen by 16 Years of TRMM PR M. D. Zuluaga and R. A. Houze, Jr. University of Washington PMM Science Team Meeting, Baltimore, 7 August 2014
Use TRMM to find the most pronouncedconvective & stratiform elements Identify every contiguous 3D echo object (“storm”)seen by PR Convective component Stratiform component Extreme characteristic Contiguous 3D volume ofconvective echo > 40 dBZ Extreme characteristic Contiguous stratiform echowith horizontal area > 50 000 km2 “Broad stratiform region” Horizontal area > 1 000 km2 “Wide convective core” Top height > 10 km “Deep convective core”
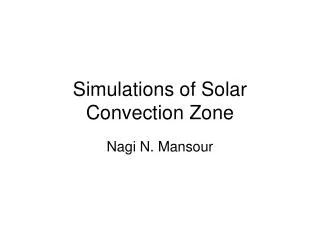
DCC BSR Land WCC Coastal Open ocean
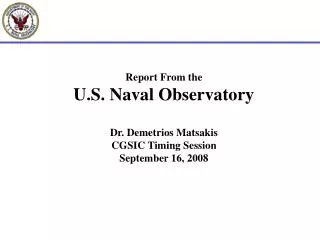
Synoptic Scale Environments (ERA-I)
Africa 700 hPa anomaly fields: • Geopotential height • Wind vectors
Coast of Tropical America 850 hPa anomalies
Anomalies of divergence and specific humidity Div. Orographic Enhancement over Andes Andes Andes
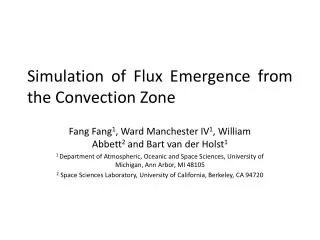
Storms with BSR associated with Tropical Cyclone (TC) development in the East Pacific Tropical disturbance trajectory* Storms with BSR Storms with BSR associated to a TCs *database: Northeast and North Central Pacific hurricane best-track data (HURDAT2, NHC) ~30% of storms
Summary: Behavior of extreme convective metrics in the near equatorial region DiurnalStrongest for DCCs over landSequence consistent with upscale growth: DCCWCCBSR Orographic Powerful enhancement of WCC & BSR by flow over Andes Synoptic Prominent for mesoscale organized features: WCC & BSR Maxima of WCC and BSR associated with lows at 850-700 hPa BSR over oceans max in regions of TC genesis
End This research was supported by: NASA grants NNX13AG71G, NNX12AJ82G, NNX10AH70GDOE grant DE-SC0008452NSF grants AGS1144105 and AGS1355567
DCC BSR WCC
Summary: Behavior of extreme convective metrics in the near equatorial region DCCs mark the early stage of MCS40 dBZ over land, 30 dBZ over oceanstrongly diurnally forced—especially over mountains WCCs aggregated intense convection—in maturing MCSsoccur over both land and seaoccur later in day than DCCassociated with 700 hPa synoptic-scale cyclonic flowenhanced by orographic lifting BSRs occur in late stages of MCSsmostly oceanic—near west coastsdiurnal variability is slight but max later than WCCassociated with TC development over oceans west of Africa and SA
Association of echo types with convection metrics Deep & Wide Deep conv. Wide conv. Broad Str.