Download
1 / 21
330 likes | 801 Views
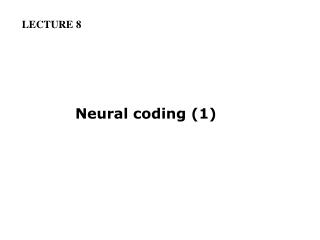
LECTURE 8. Neural coding (1). Introduction − Topographic Maps in Cortex − Synesthesia − Firing rates and tuning curves. Why Neural Coding?. A way for us to understand high-level brain functions (in the views of information theory and statistical inference) It answers:

E N D
LECTURE 8 Neural coding (1)
Introduction • − Topographic Maps in Cortex • −Synesthesia • −Firing rates and tuning curves
Why Neural Coding? • A way for us to understand high-level brain functions (in the views of information theory and statistical inference) • It answers: • How external stimuli are represented in the form of neural activities (internal representation)? • How this internal representation is further read-out in neural systems? Encoding Decoding External Stimulus Mental Operation Neural Activity (internal representation)
Different areas of the cerebral cortexcarry out different functions (Gazzaniga et al., Cognitive Neuroscience)
‘Where’ and ‘What’ visual information pathways in object recognition ‘Where’: the motion and spatial location ‘What’: form recognition and object representation (detailed features like colour) and also long-term memory (Gazzaniga et al., Cognitive Neuroscience)
Visual feature processing from simple to complex (Gazzaniga et al., Cognitive Neuroscience)
Topographic maps in cortex - Each visual sensitive cell only responses to stimuli a limited region (receptive field) - Neighbouring cells have partially overlapping receptive fields -Neighboring points in a visual imageevoke activity in neighboring regions of visual cortex. - In this manner, the visual system easily maintain the information of the spatial location of stimulus (Dayan and Abbott2001) Retinotopic Map
The tonotopic map in the auditory areas The sound frequency is orderly mapped in the auditory cortex (Gazzaniga et al., Cognitive Neuroscience)
The topographic maps in thesomatosensory and motor cortex (Gazzaniga et al., Cognitive Neuroscience)
Examples of synesthesia • When a man looks at printed black numbers, he sees them in color • A girl sees blue when she listens to the note C played on the piano; other notes evoke different hues • People with synesthesia can provide valuable clues to understanding the organization and function of the human brain• Neural cross wiring may lie at the root of synesthesia
Tastes experienced by synaesthete E.S. E.S.-- a 27-year-old professional musician who is female,right-handed and of average intelligence (Beeli,Esslen, Jäncke, 2005)
(Ramachandran and Hubbard 2003)
Rate coding: • Information is encoded in the firing rate. • Temporal coding: • The fine structure of the pattern of inter-spike • intervals (ISIs) containsinformation
Tuning curve Neuronal responses typically depend on many different properties of astimulus. Tuning curve of the average firing rate can be measured by only considering one of the stimulus attributes Gaussian tuning curve Froma neuron in the primary visual cortex of amonkey
Recordings fromthe primary motor cortex of amonkeyperformingan arm reaching task
Firing rate versus head direction plot for a typical head direction cell
Irregularity of cortical neural responses •Tuning curves allow us to predict the average firing rate, but they do notdescribe how the spike-count firing rate varies about its mean valuefrom trial to trial • While the map from stimulus to averageresponse may be described deterministically, it is likely that single-trialresponses can only be modeled in a probabilisticmanner • The Poisson process providesan extremely useful approximation of stochastic neuronal firing
The probability that any sequenceof n spikes occurs within a trial of duration Tobey the Poisson distribution: Simulating Poisson spike sequences:
Comparison with data Interspike interval histogram generated from a Poisson model From an MT neuron respondingto a moving random dot image (Dayan and Abbott2001)
Two cases • The homogeneousPoisson process: the firing rate is constant over time • Theinhomogeneous Poisson process: involves a time-dependent firingrate Where is the neural response variability from? • Single neuron level: • -Unreliable release of neuro-transmitters • - Stochasticity in channel gating • - Fluctuations in the membrane potential • Network level: • - Neurons are randomly connected with each other • - Background stimuli from a changing environment to • neural systems
Key points: • Topographic maps in cortex • Tuning curve • Spike-train statistics