Download

1 / 62
620 likes | 760 Views
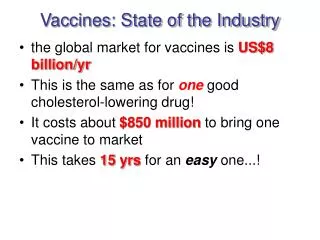
State of the Industry. Todd Hale SVP, Consumer & Shopper Insights August 5, 2014. Table of contents. Retail Landscape & Performance What’s Selling Retail Hot Buttons Closing Thoughts. 2. 2. Retail Landscape & Performance. Is flat the best we can expect?. All Departments.

E N D
State of the Industry Todd Hale SVP, Consumer & Shopper Insights August 5, 2014
Table of contents • Retail Landscape & Performance • What’s Selling • Retail Hot Buttons • Closing Thoughts 2 2
Is flat the best we can expect? All Departments Shouldn’t an economic recovery be delivering more growth? Source: Nielsen Strategic Planner; Total U.S. All Outlets Combined (plus Convenience), All Departments, All Brands (UPC), % Change, 52 week periods vs. year ago
Good news & bad news Good News: Rising Consumer Confidence Bad News: $5 billion reduction in SNAP benefits Bad News: Natural gas prices rising Good News: Home heating oil prices falling Good News: Social security recipients receive 1.5% cost of living increase Good News: Minimum wage increased in 13 states on 01/01/14 Bad News: 1.3 million lost extended unemployment benefits on 12/28/13 Bad News:“17% of homeowners deeply underwater”* Bad News: “Pay to rise with whimper, not a bang”* Bad News: 2013 U.S. population growth rate slowest since 1937 Bad News: Rising gas prices Sources: Nielsen; U.S. Government; *USA TODAY
Value & convenience winning All Departments – Dollar Sales & Trend Supermarkets Value* C-Stores Drug Stores Low Growth High Growth Total measured channels: $777 Billion & up 1.2% Source: Nielsen Scantrack, Total U.S., 52 weeks ending 06/07/2014 (vs. year ago), UPC-coded; *Club Stores, Dollar Stores, Mass-Merchandisers, Military
Value & convenience drive store expansion U.S. Store Counts 69% + of growth from niche formats vs. 2005 Expansion from all formats but Mass Merchandisers in 2013 vs. previous year Source: Nielsen TDLinx Value & Convenience
E-commerce the big winner CAGR 2013 to 2018 Winning Share Average Growth Losing Share Source: Nielsen TDLinx & Nielsen Analytics
E-Commerce coming to CPG, but @ what speed E-Commerce steadily growing sales Amazon sales growth very impressive Global annual sales growth versus prior year (in billions) $13.4 $7.5 Amazon Walmart Kroger $1.6 AmazonFresh expanded from Seattle to Los Angeles & San Francisco Step on the gas! Who can get there faster? Source: U.S. Census Bureau; company reports & websites
Demand shifts behind winners & losers Absolute Dollar Loss/Gain versus four years ago Top 10 with increases vs. 4-years ago Snacks Fresh Produce Candy Coffee Vitamins Packaged Meat Beer Tobacco & Accessories Cheese Wine Top 10 with decreases vs. 4-years ago Computer/Electronic Prods Magazines Selected Title Film & Cameras Gum Cereal Detergents Disposable Diapers Office/School Supplies Vegetables-Canned Puddings/Desserts-Dairy Overall gains were $72 billion versus four years ago; 23 categories with decreases; 97 categories with increases Source: Nielsen Strategic Planner, Total U.S. – All Outlets Combined (plus Convenience, 52 weeks ending 06/07/2014 (vs. 4-years ago), UPC-coded, 120 major category groupings
Inflation & demand driving growth All Outlets Combined (plus Convenience) – Dollar Trend Center Store departments struggle Source: Nielsen Strategic Planner, Total U.S. – All Outlets Combined (plus Convenience), 52 weeks ending 06/07/2014 (vs. year ago), UPC-coded
CONSUMERS SHIFTING SPEND OR BUYING LESS All Outlets Combined (plus Convenience) – Unit Trend Shouldn’t an economic recovery be delivering more unit growth? Source: Nielsen Strategic Planner, Total U.S. – All Outlets Combined (plus Convenience), 52 weeks ending 06/07/2014 (vs. year ago), UPC-coded
Sugar Dollar Sales drop with falling prices Total Sugar & Sugar Substitutes Unit sales fairly flat for last 4 + years Source: Nielsen Answers; Total U.S. All Outlets Combined (plus Convenience), All Departments, All Brands (UPC), % Change, 52 week periods vs. year ago
Key sugar ingredient categories generate a lot of retail revenue Dollar sales (billions) in Sugar categories % Change YAGO + 2 + 2 - 1 + 3 NC - 9 Sales up or flat in these categories * Includes HFCS sweetened & sugar sweetened Source: Nielsen Strategic Planner; Total U.S. All Outlets Combined (plus Convenience), All Brands (UPC), 52 weeks ending 7/5/2014
Retail Hot Buttons Price & Value Private Brands Right-Sized Box Food Fight Winning with Non-Edibles Connecting with Shoppers That Matter Digital Shopping Health & Wellness Sustainability Experiential Retailing
Consumers Flock to Fresh Dollar growth for all & volume gains in most; higher prices part of the mix too Source: Nielsen Perishables Group FreshFacts , Total U.S. – Fresh Coverage Area (grocery + WM, Sam’s Club and Target); 52 weeks ending 5/31/2014 (vs. year ago)
Deli prepared foods growing Growth continues as shoppers choose meals & meal components over ingredients • Total Store ** Unit Growth: +0.2% Prepared food purchases from supermarkets, drug stores & other retail outlets will GROW 10% BY 2022*** Sources: *Nielsen Perishables Group FreshFacts , Total U.S. – Fresh Coverage Area (grocery + WM, Sam’s Club and Target); 52 weeks ending 5/31/2014 (vs. year ago); **Nielsen Scantrack, Total U.S. – All Outlets Combined, plus Convenience, 52 weeks ending 6/7/2014 (vs. year ago), UPC only; ***NPD Group
Bakery department capturing growth in categories where sugar is key ingredient Growth continues as shoppers choose meals & meal components over ingredients • Total Store ** Unit Growth: +0.2% Sources: *Nielsen Perishables Group FreshFacts , Total U.S. – Fresh Coverage Area (grocery + WM, Sam’s Club and Target); 52 weeks ending 5/31/2014 (vs. year ago); **Nielsen Scantrack, Total U.S. – All Outlets Combined, plus Convenience, 52 weeks ending 6/7/2014 (vs. year ago), UPC only; ***NPD Group
Food Lion debuts new store format • Daily dinner deals • “Grab & Go” foods • New garden cooler, which keeps fruits and vegetables fresher, longer • Expanded gluten-free section • $1 Deals • New Food Lion-brand beef in sealed-fresh packaging Sources: Food Lion, Supermarket News & Salisbury Post (photos)
See how your Target's been refreshed 1,261 Target stores w/expanded food Source: Target
Integrated campaign to revive established categories “Cans get you cooking, a multi-year, fully-integrated campaign” Source: Cans Get You Cooking
fish where the fish are! Secondary location with multi-media support “new displays, menu boards & signage in 3000+ Walmart’s gave Coke a level of branding never seen before” Source: http://cargocollective.com/samcrews/Coke-Walmart-Goes-Well-With
Shaking up the aisle Is it time to convert trade spend to capex spend? Source: http://vmsd.com/content/mega-foods-eau-claire-wis; Photography: Mark A. Steele Photography, Columbus, Ohio; Note: capex = capital expenditures
Long-term FOOD-away-from-home share at highest point ever Share of total U.S. food expenditures: 50.5% 49.5% Food expenditures based on actual sales Source: Calculated by the Economic Research Service, USDA, from various data sets from the U.S. Census Bureau and the Bureau of Labor Statistics.
performance index above 100 for the 15th consecutive month; highest in over 2 years Source: http://www.restaurant.org//Downloads/PDFs/News-Research/index/RPIMay2014
Just outpacing brand growth since 2012 All Departments Source: Nielsen Strategic Planner, Total U.S. – All Outlets Combined (xAOC), Total All Departments, UPC-coded
Where are the growth opportunities? Private Brands: Dollar Share Top 10 Milk Eggs-Fresh Sugar/Sugar Substitutes Wrapping Materials Bags Dessert/Fruit/Tops-Froz Unprep Meat/Seafood-Frz Fruit-Canned Pain Remedies Cheese First Aid Average $ Share 17.5% Bottom 10 Computer/Electronic Prods Beer Deodorant Tobacco & Accessories Gum Canning/Freezing Supplies Wine Liquor Hair Care Insecticides Repellants Edibles Non-Edibles Are they bigger in low or high share categories? What other considerations? Source: Nielsen Strategic Planner, Total U.S. – All Outlets Combined (xAOC), 52 weeks ending 06/07/2014 (vs. year ago), UPC-coded, 116 major category groupings
Supermarkets dominate best of breed Store Brands $ Share of Total Store Average 24% 20% 18% 18% 18% Supermarkets Club Mass w/Supers Dollar Drug Limited assortment/extreme discount formats lead the way Source: Nielsen Homescan, 52 weeks ending 12/28/2013, UPC-coded items
“Private-label foods often meet or beat the big brands” Our expert tasters judged 33 of 57 store-brand foods as good as or better than the national brand. In categories such as ice cream, trail mix, mozzarella, mixed vegetables, and more, we found at least one store brand from the national grocers Costco, Kmart, Sam's Club, Target, Trader Joe's, Walmart, and Whole Foods that was equal in quality to the big name. Consumer Reports August 2013 Source: NBC News & Consumer Reports
Kroger Simple Truth expected to hit $1 Billion; H-E-B introduces Affordable Organic Options • Beef • Teas • Salads • Carrots • Café Ole • Oatmeal & Cereals Kroger’s eye catching in-store merchandising; its own website & array of social media H-E-B- shelf tag Source: Todd Hale (in-store photo); Kroger, http://www.simpletruth.com/; H-E-B
Walmart & Wild Oats To DRIVE Down Organic Food Prices Nearly 100 organic products – no price premium Source: Walmart
Back to the future Walmart testing Extreme Value Brand Source: Facebook (Walmart-Lebanon); My Private Brand
FreshDirect launched TWO private brands Cloud 9 is about high quality, effective products in the household and cleaning categories that our customers can count on to get the job right. JUST FreshDirect will include food products with a focus on simple, short ingredient statements, wholesome ingredients and transparency when it comes to what’s in each product. One of the key elements to our JUST FreshDirect brand is that we have a list of prohibited ingredients. We have plans to launch over 150 new private brand products in 2014… We also have more brands in the works so expect more exciting news over the next year. Mypbrands.comDec. 2, 2013 Source: mypbrand.com
All groups have lost since 2000 But Blacks & Hispanics have suffered the most % Change vs. 2000: Non-Hispanic White: -6.3% Asian: -7.7% Hispanic: -11.8% Black: -15.8% Source: USA TODAY (story by Tim Mullaney; graphics by Frank Pampa & Anne R. Carey – 9/18/2013))
Diversity in sugar buying & in categories where sugar is key ingredient Annual $ Per Household Among Category Buyers Watch Out: a number of categories with low buying rates among multicultural Source: Nielsen Homescan, Total U.S. 52 weeks ending 12/28/2013, UPC-coded products; Note: Categories include sugar-free products
By 2020, Millennials will outnumber boomers by ten million U.S. Population Projections - 2020 Age Boomers 34 million 37 million Gen X 24 million 25 million Millennials 41 million 40 million Population (millions) Source: U.S. Census Bureau (2012 National Population Projections)
Gray power surge 100 Millions Percentage 0 Will advances in medical technology alter the curve? Source: U.S. Census Bureau (2012 National Population Projections)
Older more trips; younger bigger baskets Total Retail Channels Millennials more deal prone Source: Nielsen Homescan, Total U.S. 52 weeks ending 12/28/2013, excludes gas only or Rx only trips; *UPC-coded products
Millennials less engaged in sugar & in key sugar ingredient categories Annual $ Per Household Among Category Buyers Source: Nielsen Homescan, Total U.S. 52 weeks ending 12/28/2013, UPC-coded products; Note: Categories include sugar-free products
Target tries to win hearts & clicks of Millennials & College Students Replacing in-store registry kiosks with iPads; replacing scanning guns with the iPod Touch Target overhauling their wedding & baby registry business, integrated shopping lists with live store maps, and testing same-day delivery for some online orders; and introduces first ever college registry Source: Target
Health & Beauty Care senior focus Sources: MultiAd Kwikee & company websites
Smaller portion sizes, but what else? Source: MultiAd Kwikee
Health & wellness enthusiasts w/strong buy rate in many key sugar categories $ Buying Rate Index Source: NMI, Health & Wellness Segmentation, Total U.S. – 52 weeks ending 12/28/2013, UPC-coded; Note: Categories include sugar-free products
Amazon gets it AMAZON GOING AFTER REGULARLY SCHEDULED BUYS COMPETITION HEATS UP W/AMAZON PRIME PANTRY “THE NEW WAY TO SHOP FROM HOME” Sources: https://www.amazon.com/gp/subscribe-and-save/details/index.html http://www.amazon.com/gp/browse.html/?node=5856180011 https://fresh.amazon.com/dash