Download
1 / 7
70 likes | 228 Views
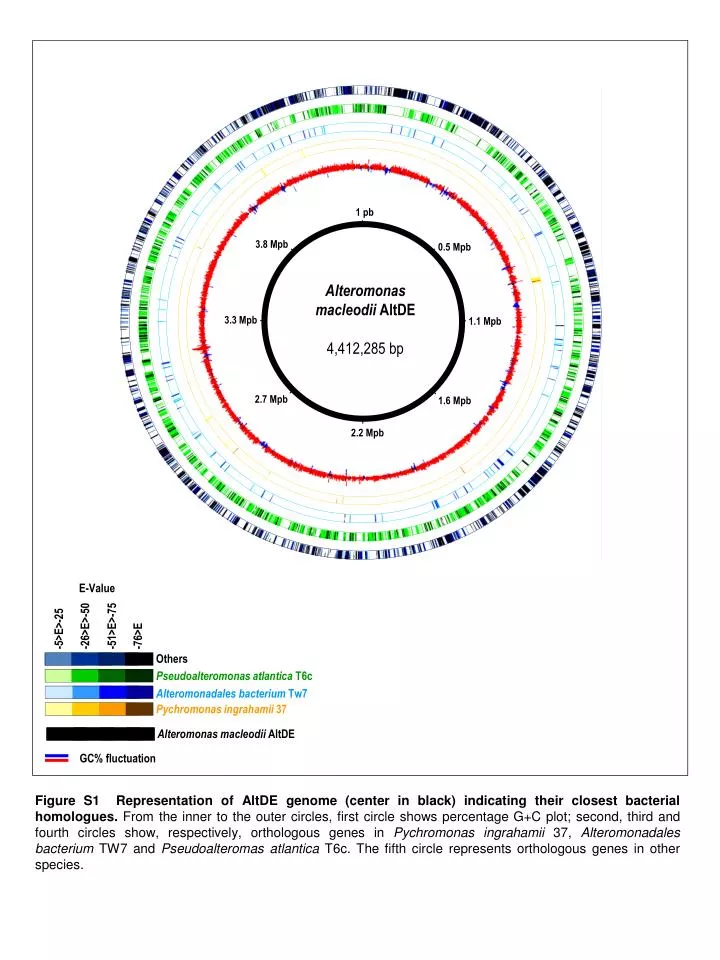
1 pb. 3.8 Mpb. 0.5 Mpb. Alteromonas macleodii AltDE 4,412,285 bp. 3.3 Mpb. 1.1 Mpb. 2.7 Mpb. 1.6 Mpb. 2.2 Mpb. E-Value. -26>E>-50. -51>E>-75. -5>E>-25. -76>E. Others. Pseudoalteromonas atlantica T6c. Alteromonadales bacterium Tw7. Pychromonas ingrahamii 37.

E N D
1 pb 3.8 Mpb 0.5 Mpb Alteromonas macleodii AltDE 4,412,285 bp 3.3 Mpb 1.1 Mpb 2.7 Mpb 1.6 Mpb 2.2 Mpb E-Value -26>E>-50 -51>E>-75 -5>E>-25 -76>E Others Pseudoalteromonas atlantica T6c Alteromonadales bacterium Tw7 Pychromonas ingrahamii 37 Alteromonas macleodii AltDE GC% fluctuation Figure S1 Representation of AltDE genome (center in black) indicating their closest bacterial homologues. From the inner to the outer circles, first circle shows percentage G+C plot; second, third and fourth circles show, respectively, orthologous genes in Pychromonas ingrahamii 37, Alteromonadales bacterium TW7 and Pseudoalteromas atlantica T6c. The fifth circle represents orthologous genes in other species.
a 48 670 351 515 75 74 524900 1049800 1574700 2099600 2624500 3149400 3674300 4199200 A. macleodii AltDE genome 712 460 518 51 539 550 340 b Psedudoalteromonas atlantica T6c genome A. macleodii AltDE genome A. macleodii AltDE genome A. macleodii ATCC 21256 contigs > 30 Kbp Pseudoalteromonas atlantica T6cgenome %ID scale 74 76 78 80 82 84 86 88 90 92 94 96 98 Figure S2 (a) Regions of co-linearity shared by assembled contigs of the A. macleodii ATCC 27216 (larger than 30 Kbp) and the genome of A. maclodii AltDE. Syntenic regions are represented in red and inversions in blue. (b) Sinteny of A. macleodii AltDE with Pseudoalteromonas atlantica T6c.
a GI 3 Phage related DNA polymerase Enterobacterial phague gp25 ATPase AAA superfamily DNA directed DNA polymerase I 834088 Phague Bcep22 gp55 Phage Stx2-82-gp25 Enterobacterial phague gp24 Phage related p. Phague, PaP3 Phague PBC5 Phage related p. Phague PBC5 Phage Stx2-82-gp25 Phage phi018p Membrane anchor virus p. PKD domain Endodeoxyribonuclease 2200 bp 891155 GI 10 b Type I restriction modification system Ubal thif-type NAD /fad binding fold FunZ 3882928 3914088 Plasmid maintenance system antidote p. deoxyribonuclease methyltransferase 2200 bp GI 11 c Reverse transcriptase integrase domains ISS Transposase ISCps1 Transposase IS911 4062499 4039705 Transposase ISCps1 Transcriptional regulator XRE family 2200 bp GI 13 d Type I restriction modification system Transcriptional regulator, XRE Transcriptional regulator DNA or RNA helicase superfamily II Inner membrane p. HipA Filamentation p. 4387945 4359069 VrlI HipA Phage transcriptional regulator AlpA SAM dependent methyltransferase transcriptional regulator methyltransferase Helix-turn-helix DEAD/DEAH box helicase Restriction subunit 2200 bp Phage related Outside of the island Hypothetical p. Transposase Integrase, IS element Figure S3 Genomic islands of A. macleodii AltDE with putative phage origin. Schematic representations of ORFs and their functional assignment are shown for (a) Genomic island 3; (b) Genomic island 10; (c) Genomic island 11; and (d) Genomic island 13.
a GI 1 Cytochrome BD-II oxidase FAD dependent pyridine nucleotide disulphide Zn- dependent glyoxylase Outer membrane p. Thiol-disulfide interchange p. Cytochrome D ubiquinol oxidase YdhE (NsrE) RelA /SpoT mdlB sub. I sub. II * 84100 Outer membrane receptor Alkyl hydroperoxide reductase Transcriptional regulator, LuxR family Choline-glycine betain transporter ATP cytochrome related transport Cation efflux system CzcA Rhodanesa related sulfurtransferase Metallo-b-lactamase Type III restricition enzyme Membrane fusion HlyD secretion p. ATP binding protein FhuE receptor Methyltranferase type II Transcriptional regulator ATPase- DNA repair 142154 ABC multidrug transporter system Cystein desulfurase 2200 bp b GI 6 Vitamine K epoxide reductase Chain II cytochrome oxidase Chain I cytochrome oxidase 4-hidroxy-2-oxoglutarate aldolase Keto-deoxyglucono-kinase GntR regulatory p. Sensory box/GGDEF ISSod6 * 1577210 1606929 Dioxygenase (ferredoxin reductase) Toxin/Antitoxin system MazE/MazF Keto-deosyglucono-kinase ISSod6 Alginate lyase precursor 2200 bp c GI 12 His-Kin. Nitrate / nitrite specific CBS domain pair Nitrate transporter Molybdopterin cofactor biosynthesis (a b and g sub.) nitrate reductase g a E C B A MoeA b 4138524 Molybdopterin guanine dinucleotide synthase Parvulin peptidyl-prolyl-isomerase Nitrate/nitrite response regulator CheY Nitrate reductase chaperone NarJ Mo converting factor sub.1 Molibdenum ABC transporter system Anaerobic nitric oxide reductase transcription regulator Oxoisovalerate dehydrogenase a and b sub. Lipid carrier p. Heme/copper membrane p. Anaerobic ribonucleoside tri-phosphate reductase Nitrate transporter Hemerythrin cation binding p. proteases 4184769 MoeB ABC transporter ATPase Thiamine pyrophosphate binding domain Acyl-CoA dehydrogenase NO signalling NorA Invasion gene expression up-regulator SirB Serine-threonine p. kinase Radical enzyme activating protein Nitrate transporter 2200 bp Outside of the island Heavy-metal related p. Hypothetical p. Nitrate reductase Phage related Molibdopterin cofactor biosynthesis Transposase Other Nitrogen metabolism related p. Integrase, IS element Figure S4 Genomic islands of A. macleodii AltDE containing genes for alternative catabolic pathways. Schematic representations of ORFs and their functional assignment are shown for (a) Genomic island 1; (b) Genomic island 6; and (c) Genomic island 12.
a phosphomanomutase ISDet2-transposase Glycosyltransferase II G II G II 1003524 1035257 Lipopolysaccharide-A p. Manose-1-phosphate-guanylyltransferase Iduronate sulfatase flagellin 2200 pb b O-acetyltransferase G II 2814735 2805984 Capsule polysaccharide biosynthesis Polysaccharide biosynthesis p. 1000 bp GI 5 c G II G II 1374175 Lipopolysaccharide modification acyltransferase Polysaccharide biosynthesis Asparagine synthase Dolichyl-phosphate mannose synthase Secreted polysaccharide polymerase FAD binding p. 1418585 Hpr Kinase TPR domain p. 2200 bp d GI 7 Type I secretion ATPase, PrtD HlyD secretion p. Giant-protein (VCBS repeats) 2464633 Thiopurine S-methyl transferase 2436218 2200 bp e GI 8 Flagellar chaperone FliS Methionyl-tRNA formyl transferase Methionyl-tRNA-formyltransferase Flagellin FliC-like FlaG 3146590 3169706 Flagellar capping p. FliD NeuA, CMP-N-acetylneuraminic acid synthase NeuB, sialic acid synthetase LmbE Maf-1 Flagellin FliC-like Flagellar synthesis FlgL 2200 bp Hypothetical p. Glycosyl-transferase Transposase Polysaccharide / Carbohydrate related p. Integrase, IS element Outside of the island Figure S5 Genomic islands of A. macleodii AltDE containing genes coding for cell surface components. Schematic representations of ORFs and their functional assignment are shown for (a) the region between MADE_00965 and MADE_00985; (b) Genomic island 7; and (c) Genomic Island 8.
Concentration of Zn(O2CCH3)2 mM 1,0 0,01 C + 0,1 5,00 1,6 ATCC 27126 1,4 AltDE 1,2 1 D.O (595 nm) 0,8 0,6 0,4 0,2 0 0 10 20 30 40 50 60 Time (h) Figure S6 Growth curves of AltDE and ATCC 27126 at different Zinc concentrations.
a metal resistance / hydrogenase lysogenic phage mercury resistance putative phages alternative LPS O-chain CRISPR /urease putative phage nitrate respiration microaerobic respiration flagellin giant protein Genomic Islands 4 5 7 8 13 6 9 10 11 12 1 2 3 0.0 Tetranucleotide frequency 0.1 Alteromonas macleodii AltDE genome b Ile Lys Arg Glu Ser Ala Val Leu His Trp Tyr Cys Met Asp Glu Asn Thr Gly Pro Phe TGG TAT AAA TAC CTT CCT GGG CCC CGA CGT AAC AGC ACG CAT AGA TCG GGA CCA CCG AAG AGG CGC GAG ACC GGC GAT AGT TCC TTG GGT TGT CGG GAC ACA ATG TCA TCT ACT CAC ATA TTC GAA ATT TGC AAT TTA CAA CAG TTT ATC CTC CTA CTG GCA GCC GTG GCT GTC GCG GTA GTT 0,8 0,4 Frequency codon usage 0 -0,4 GI3 GI10 GI11 GI13 -0,8 0,8 0,4 0 -0,4 GI4 GI9 -0,8 0,8 0,4 0 -0,4 GI5 GI6 GI7 GI8 -0,8 0,8 0,4 0 -0,4 GI1 GI2 GI12 -0,8 Figure S7 AltDE tetranucleotide skew and codon use. (a) AltDE genome tetranucleotide frequency skew (calculated in sliding windows of 25 Kbp). (b) Differences in the frequency use of a given codon between AltDE islands and the complete genome. The usage fraction of a codon was calculated as its proportion (0 to 1) referred to the most common codon. Each codon use value in an island was subtracted from that calculated for the complete genome, thus values closer to zero indicate more similar codon use.