Download
1 / 28
280 likes | 412 Views
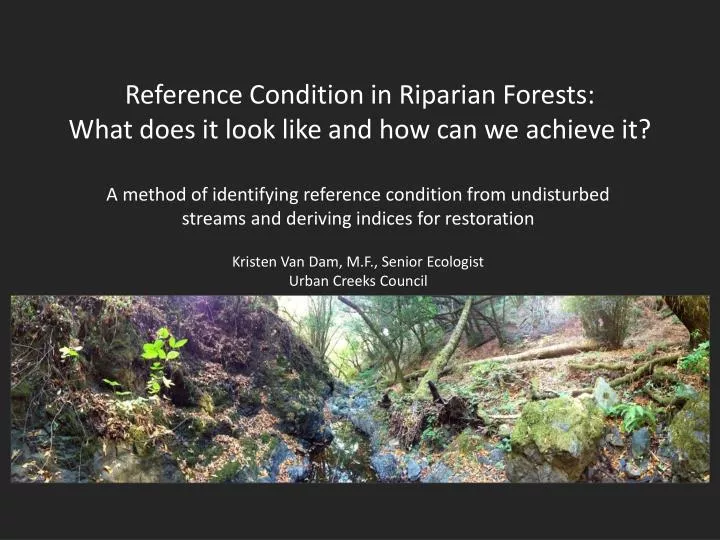
Reference Condition in Riparian Forests: What does it look like and how can we achieve it?. A method of identifying reference condition from undisturbed streams and deriving indices for restoration Kristen Van Dam , M.F., Senior Ecologist Urban Creeks Council.

E N D
Reference Condition in Riparian Forests:What does it look like and how can we achieve it? A method of identifying reference condition from undisturbed streams and deriving indices for restoration Kristen Van Dam, M.F., Senior Ecologist Urban Creeks Council
Shortcomings in success criteria • Permit requirements focus on simplistic performance criteria: percent survival or percent cover • Standards for success do not address ecosystem function – does your project actually work? • limited correlation between ecosystem function and percent survival/percent cover criteria • Lack of guidelines for selection of “reference sites” can result in the bar being set too low • If reference condition is not incorporated into project monitoring, we’ll never know if project approximates reference • This limits recovery of damaged systems – we may not be maximizing results for our investment
Goals &performance criteria for restored riparian woodlands • There is no consistent definition of restoration success for riparian woodlands • We propose that long-term success should be measured by degree to which a site approximates reference condition • Thus, reference condition must be defined and assigned measurable metrics • Tools are needed that incorporate both robust science and usable assessment protocols
Characteristics of a good toolkit • Minimizes subjectivity • Data collection is simple and inexpensive • Indicators measure relative ecosystem function • Indicators are detailed enough to be used to model restoration projects, yet • Universal enough to allow a bar to be set
Challenge 1/2 : Measuring function • Ecosystem function is extraordinarily complex and difficult to measure directly Solution: • Ecosystem structure can be used as a proxy for function (Stein et al 2009) • CRAM protocol incorporates this concept
Challenge 2/2 : Locating reference sites • No statewide vegetation reference program Solution: • Select other riparian program sites representing “best achievable condition” as proxies for vegetative quality • CRAM • SWAMP • Lunde (2011) (SWAMP) • Riparian Bird Index (PRBO) • Conserved remnant riparian • These protocols are useful for approximating high ecosystem function but they do not result in usable vegetation reference information. Solution: • Develop new protocol
Study Area andReference Site Locations • EPA level III “Coastal Sage Scrub, Chaparral, and Oak Woodlands” ecoregion • 15 SWAMP sites (including Lunde, 2011) • Three CRAM sites • Two RBI sites (PRBO) • One remnant site selected by author
Riparian Vegetation Reference (RiVR) Index Species Richness Relative Abundance Diameter class distribution Forest or woodland alliances Manual of California Vegetation (2009) Structural composition (layers and their dominant constituents) Stems per acre Modeled species-area curves from site data Regional species-area curve (preliminary) Result: Toolkit for identification of reference condition
RiVR Overview • RiVR uses census sampling along a transect about the size of a CRAM site, identifies species and size class of woody plants • Reference condition metrics can be derived from agroup of reference sites • RiVR metrics are independent of species composition • Species richness can be modeled from known sample curves to derive richness target for restoration • Target trees per acre can be derived from reference group (Group average = 153 TPA) • Some RiVRmetrics aremost useful for tree species • Difficult to obtain accurate stem count for many shrubs
Similarity in metrics and site characteristics • Watersheds and boundary conditions were minimally disturbed (few roads, zero urbanization) • Sites exhibit mature vegetation structure with both large trees and recruitment of new age classes • Reference sites clearly fall into definable MCV vegetation alliances • Low (<5) woody species diversity atypical • Shrub layers usually intermittent, rarely continuous • Sites demonstrate common pattern of relative abundance: less than 4 dominant species and at least 5 minor species, usually more • Species richness increases with site size
MCV Classification • Relative abundance analysis provides exact dominance and good proxy for relative cover • Each site defined by dominant species per MCV treatment • It appears that some ecological driver acts to sort relative abundance into predictable patterns • Given that reference sites fall into MCV alliances, it follows that restoration sites should do the same.
Majority of new species encountered in first 100 feet; 5-10 tree species per site
Patterns of species richness • Richness varies throughout reference group; some alliances appear to be intrinsically depauperate in woody species (Sequoia sempervirens, Salix laevigata) • Species richness on reference sites increases with site size • Average richness = 15 woody species at 400 feet • Different richness categories : lower-richness sites are not necessarily correlated with poor quality • But low-richness sites were atypical in the reference group
Relative Abundance • Relative abundance patterns are virtually identical across all reference sites: • Dominants defined as any species constituting greater than 10% RA on a site; minors defined as any species at less than 10% RA • Very few dominants (average <3 per site) • 82% of all species in sample are minor species Definitions: • Relative abundance: Describes the proportions of species on a given site • Mean relative abundance: Describes average relative abundance for a group of sites, i.e. all sites in an alliance or the reference group as a whole
Mean relative abundance: the majority of species are minor species
Results indicate that relative abundance is an important component ofsite composition • Dominants may provide critical functions (e.g. primary productivity, system stability), but • Prevalence of minor species throughout the reference group suggests their importance to these systems. • Relative abundance should be incorporated into planting and adaptive management goals
Diameter distribution for reference group approximates typical forest model: many small trees, few large trees
Modeling species-area relationships for riparian woody plants Composite SA curve for site group: • Model averages ~18 WP species at 1000 ft to ~24 species at 6000 ft • Richness increases with area, but not by a large amount • Individual site curves have smaller confidence intervals, as they are assemblage-specific Species Distance
Assessing sites using RiVR: A preliminary model • RiVR can be used to compareproximity to reference condition for: • Species richness • Relative abundance • Size class distribution • Trees per acre • Scoring model uses variance from reference condition to assess site condition • Restoration sites will need to be fairly mature before theycompare favorably on manymetrics
Example of theoretical RiVR scoring module • Models progressive deviation from reference condition via cumulative variance • Scores A-D by 3 top dominants and all minor species • Many different scenarios possible at each score level.
Limitations and considerations • Species-area models are critical to proper estimation of richness for restoration sites • RiVR currently incorporates only woody species and is designed for forests and woodlands only • Only half of riparian-associated MCV alliances were detected; data needed for all alliances • We don’t yet understand exactly how site dynamics influence species composition- but we know assemblages do shift over space and time
Implications for restoration and management • If restoration sites are intended to approximate reference sites— • Relative abundance patterns should be used in conjunction with species palettes • Restoration palettes should be modeled after existing vegetation alliances • Richness accumulation model indicates that richness should increase with site size, and • Suggests that restoration sites should be more species-rich than they typically are. • Discernible size classes should be present; RiVR can detect level of recruitment by size class • Any forest or woodland site, including restoration sites, can be assessed for similarity to reference condition based on RiVR metrics
Implications for monitoring & assessment • Current assessment methods (e.g. CRAM, SWAMP) do not give any information about vegetative composition, and make assumptions about desired condition that may not reflect reference condition • most reference sites do not have a lush and continuous shrub layer • Focus on dominant species may present an incomplete view to system function • RiVR can supplement other assessment methods for more detailed vegetative information
Next Steps • Preliminary RiVR scoring module in process • RiVR data needed for all riparian alliances in ecoregion (eventual total of 20 sites per alliance, 19 alliances = 360 reference sites) • Sampling method needed for shrub and herbaceous layers • Make RiVR toolset accessible for data input and experimentation