Download
1 / 10
100 likes | 404 Views
The Use and Misuse of Statistics. LG: I can assess whether valid conclusions have been drawn, based on given data. Assessing Data. A valid conclusion is one that is supported by unbiased data that has been interpreted appropriately. Questions to consider when analyzing data:

E N D
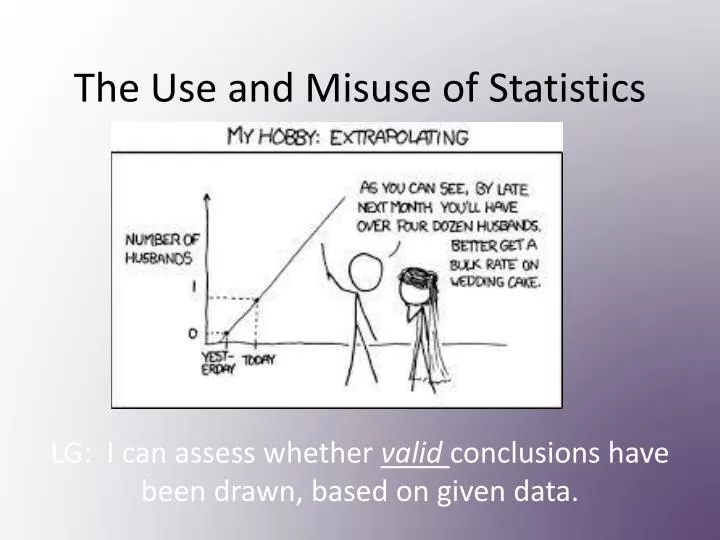
The Use and Misuse of Statistics LG: I can assess whether valid conclusions have been drawn, based on given data.
Assessing Data • A valid conclusion is one that is supported by unbiased data that has been interpreted appropriately. • Questions to consider when analyzing data: • Was the data collection biased in any way? (type of questions, type of sample, etc.) • If measurements were required, were they taken accurately? • If there are graphs, are they drawn accurately, or do they mislead the viewer?
Example: Assessing Graphical Data • Consider the following pair of graphs: • Which stock Is more profitable? • How is the image misleading?
Assessing Graphical Data • Things to consider: • Does each axis begin at zero? (may not be appropriate if number are very large) • Is the graph 3-D? If so, does the image misrepresent the data? • Is there text on the graph? Is the text (font/size/location) the same in all parts of the graph? Does the text distort the image in any way?
Recognize this? • Critique the data presented in the following graph • Do you feel that the information is biased? • Do you think the author of the ad supported a particular viewpoint?
Example: Assessing Data Collection • Dexterity Study: 500 people are invited to a research center for an experiment in dexterity and flexibility. 100 of the people show up. The researchers document the number of people who can clasp their rightfoot with their right hand behind their backs, by reaching over their right shoulders (as seen at the right). They conclude that an amazing 62% of people can perform this act of dexterity and flexibility. • Are these finding reliable? What is wrong with this study?
Assessing Data Collection • Things to consider: • Does the group collecting the data have a particular interest in the results? • Is the sample size large enough? (~10%) • Was the sample random or non-random? Would ‘selection bias’ influence the results? • What was the method of collection? (anonymous/interview, etc.) Would the chosen method bias participant’s responses?
Example: Assessing “Cause and Effect” Assumptions • A group of students collected information about the age of students entering college or university and their first-year marks. They found that the younger students were, the lower their first-year marks tended to be. • They concluded that younger students were not mature enough to handle the responsibility of post-secondary education and this caused a decline in their first-year marks
Assessing “Cause and Effect” Assumptions • Things to consider: • Is the correlation strong? (can be positive or negative) • Is it possible that both variables could be dependent on a third factor? • Have other possible factors been eliminated?
Homework • Pg. 229-232 # 1-4, 7, 9-12 • Test Next Monday! (Thursday and Friday will be review)