Download
1 / 64
640 likes | 806 Views
About Us. Active Healthy Kids Canada is a national charitable organization established in 1994 that works to power the movement to get kids moving ™

E N D
About Us Active Healthy Kids Canada is a national charitable organization established in 1994 that works to power the movement to get kids moving ™ Provides strategic national leadership – advancing knowledge, evidence-informed communication and advocacy strategies– to influence issue stakeholders who affect physical activity opportunities for children and youth The primary vehicle to achieve this mandate is the Active Healthy Kids Canada Report Card on Physical Activity for Children and Youthand its related activities
Report Card The Report Card, now in its ninth year of production, is an evidence-informed communications and advocacy piece designed to provide insight into Canada’s “state of the nation” each year on how, as a country, we are being responsible in providing physical activity opportunities for children and youth. Our model has been replicated in other jurisdictions around the world including Kenya, South Africa, Mexico and Louisiana.
Report Card Indicators and Grades • The 2013 Report Card assigns letter grades to 17 different indicators grouped into three categories. • Grades are based on an examination of current data against a benchmark along with an assessment of trends over time, international comparisons and the presence of disparities. • Together, the indicators provide a robust and comprehensive assessment of physical activity of Canadian children and youth
Grade assignments • are determined based on examination of the • current data and literature for each indicator against a • benchmark or optimal scenario, assessing the indicator • to be poor, adequate, good or excellent: • A = We are succeeding with a large majority of • children and youth. • B = We are succeeding with well over half of • children and youth. • C = We are succeeding with about half of children • and youth. • D = We are succeeding with less than half, but some, • children and youth. • F = We are succeeding with very few children and youth. Methodology
Opportunities for Physical Activity at School Survey (CFLRI) Physical Activity Monitor (PAM; CFLRI) Quebec en Forme School Health Action Planning and Evaluation System – Prince Edward Island (SHAPES-PEI) Youth Smoking Survey (YSS) 2013 Key Data Sources • Canadian Health Measures Survey (CHMS) • Canadian Physical Activity Levels Among Youth Survey (CANPLAY; CFLRI) • Health Behaviour of School-aged Children Survey (HBSC) • Healthy Living Habits Study (HLHS) • Keeping Pace In addition, the long form Report Card includes a comprehensive set of references and a variety of specific recommendations in each section and can be accessed at www.activehealthykids.ca.
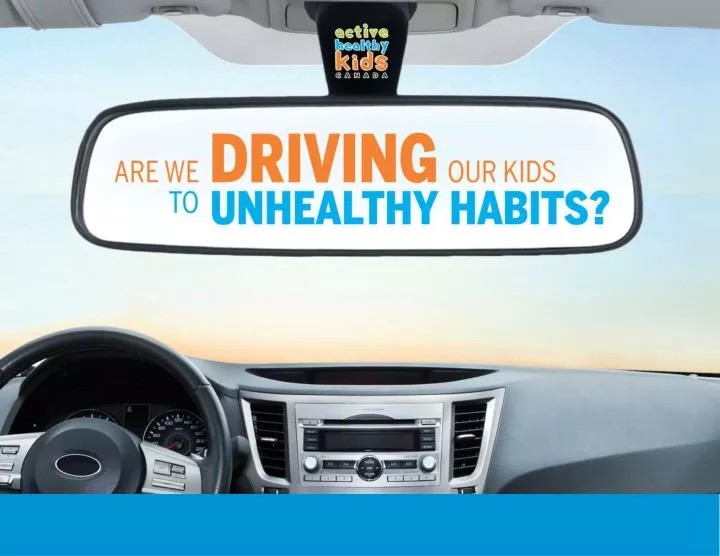
2013 Cover Story: Are we DRIVING our kids tounhealthy habits? Sedentary Behaviour
Many Canadian Children are driven to and from destinations • 58 per cent of parents walked to school when they were kids, yet only 28 per cent of their children walk to school (REF 27) • In youth aged 15-17, the daily time spent walking decreased from 17 to 11 minutes between 1992 and 2010; this decline was particularly evident in girls.29 Sedentary Behaviour
Regional Variations • Walking is the most common travel mode among elementary school children in inner-city Toronto, but children and youth from suburban areas are mostly driven to school.31 • Active transportation is more common in the territories and British Columbia, and less common in Atlantic Canada and Québec.28 • Active transportation is more common in urban areas, especially in cities with 100,000-250,000 inhabitants.28 Sedentary Behaviour
Barriers to Active Transportation • Distance between home and destination • Road and neighborhood safety • Child’s Age • Time • Convenience Sedentary Behaviour
Active Transportation is an easy, cost-effective way to increase physical activity levels in children and youth If children walked for all trips of less than 1km rather than being driven, they would accumulate approximately 15 – 20 minutes of walking per trip and have the potential to make a substantial contribution to the 60 minutes of daily physical activity kids need for overall health. 17 Sedentary Behaviour
In addition to improving overall physical health, active transportation may: • Improve fitness and heart health • Increase academic achievement • Provide social opportunities • Reduce stress • Improve air quality and reduce risk of lung diseases (e.g., asthma) Sedentary Behaviour
Steps we can take Parents/Family should: • Encourage and support their children to actively travel to and from school as well as to other destinations (friend’shouses, parks, etc.). • Share responsibility with other parents for supervision of younger kids as they travel to andfrom school and activities (e.g., take turns leading a walking bus). • Park the car a short distance from school and/or other destinations and walk from there when it is not possible for their kids to walk the whole way. Sedentary Behaviour
Steps we can take School administrators should: • Ensure that bike racks are provided in highly visible areas on school property. • Consider children’s travel needs when deciding where to build new schools. • Facilitate the implementation of school travel plans, walking school buses, road safety education and other measures to ensure active and safe routes to school. Sedentary Behaviour
Steps we can take Policy-makers should: • Enforce traffic-calming measures in communities around schools and parks (zebra crossings, speed bumps, sidewalks, flashing lights, etc.). • Encourage employers to offer flexible hours that would allow parents to support active travel opportunities for their kids. • Develop joint planning mechanisms and protocols to ensure that the built environment supports walking and biking as an easy choice for children and youth. Sedentary Behaviour
Steps you can take • Help spread the word! • Go to www.activehealthykids.ca to download the Report Card, articles, social media tools, videos, tip sheets • Use the Report Card to advocate for changes in your community • The Long Form includes several example of promising initiatives- see the section entitled Steps in the Right Direction PP. XXXXXX Sedentary Behaviour
Join us! Go to www.activehealthykids.ca/summit for registration details!
Physical Activity Levels: Benchmark % of children and youth who meet Canadian Physical Activity Guidelines 3-4 year olds: at least 180 minutes of physical activity at any intensity every day 5-17 year olds: at least 60 minutes of moderate-to-vigorous-intensity physical activity every day Physical Activity Levels
Physical Activity Levels 2013 Grade D- Figure 6. Comparison of Canadian children and youth by age group who are meeting the Canadian Physical Activity Guidelines (source: 2009-11 CHMS) Physical Activity Levels
Recommendations • The majority of Canadian children and youth need to make important changes to their routine physical activity patterns. Such changes can include increased active play, active transportation and organized sport participation. • Policy-makers, funders and programmers should target groups of children and youth that are most in need of changing physical activity patterns. Those who are adolescent girls, from an Aboriginal community, living with a disability, or from a low-income family or low education household are most in need of help. • Increase social marketing efforts to highlight the importance of being physically active every day. • Policy-makers, funders and programmers should emphasize the need for young children involved in childcare and physical activity programs to participate regularly in energetic activities. Physical Activity Levels
Research Gaps • The development and evaluation of theoretically informed interventions to increase physical activity must be a priority. Interventions need to be tailored for different contexts and settings (e.g., school, home and travel). • Accelerometer-measured physical activity data are needed on children under 3 years of age. • There is a need to better understand the relative impact of light intensity physical activity in 5- to 17-year-olds. • Research is lacking on the context of physical activity participation (e.g., outdoors vs. indoors, alone vs. with friends, spontaneous vs. structured, authentic vs. with technology or screens). Physical Activity Levels
2013 Grade C C Organized Sport & Physical Activity Participation: Benchmark % of children and youth who participate in organized sport or physical activity programs Physical Activity Levels – Organized Sport and Physical Activity Participation
Disparities • Age • Participation rates drop from 84% in 5-10 year olds to 60% in 15-19 year olds • Gender • 15-19 year old males are more likely to participate than female counterparts • Social Determinants • Participation rates increase as parental education and household income increase Physical Activity Levels – Organized Sport and Physical Activity Participation
Physical Activity Levels – Organized Sport and Physical Activity Participation
Recommendations • Coaches and parents should consider the usefulness of increasing the time children and youth spend in MVPA during organized sport and physical activity events, without taking away from the need to focus on skill development. • Provincial sport organizations and school sport clubs need to develop stronger linkages and build programs that encourage students to become engaged in sport. • Parks and recreation departments need to consider providing more opportunities for girls to engage in “sport for life” activities, and consider providing both competitive and recreational sport programs. • Youth-serving organizations should develop strategies to counter the dropout rate in organized sport and physical activities among teenagers. Physical Activity Levels – Organized Sport and Physical Activity Participation
Research Gaps Physical Activity Levels – Organized Sport and Physical Activity Participation • Research should aim to determine the contribution that organized sport and physical activity participation makes towards meeting the Canadian Physical Activity Guidelines and other health outcomes. • There is a need for a longitudinal physical literacy research program that monitors changes in physical literacy over an extended period of time. • There is a need to understand the decline in participation rates with age and how to address the potential barriers with this age group, in order to inform service providers on how to tailor their programming and opportunities. • Research is needed on how play and unorganized activities at younger ages help develop skills that are useful for sport participation at older ages.
2013 Grade INC Active Play & Leisure Benchmark Physical Activity Levels – Active Play & Leisure % of children and youth who engage in unstructured/unorganized play for several hours a day
Key Findings • Parents report that their 3- to 4-year-olds get 5.3 hours per week of physical activity outside of school while participating in unorganized activities, whether alone or with a friend (2009-11 CHMS). • Parents report that their 5- to 11-year-olds get 4.1 hours per week of physical activity outside of school while participating in unorganized activities, whether alone or with a friend (2009-11 CHMS). • Time spent in unorganized physical activity has remained stable for 5- to 11-year-olds since 2007-09 (2009-11 CHMS). Physical Activity Levels – Active Play & Leisure
Recommendations • Parents and caregivers should continue to be informed about the benefits of active play and that they are distinct from the benefits that arise from organized activities. • Parents, caregivers, and school officials need to recognize that not all injuries can be prevented, and that injuries that arise from active play could be considered “acceptable” because they are unintentional and typically minor (e.g., bumps and bruises, sprained ankle, etc.). • Policies and bylaws that pose a barrier to active play should be examined and modified. Physical Activity Levels – Active Play & Leisure
www.activehealthykids.ca/active-video-games-position Physical Activity Levels – Active Play & Leisure • Parents and caregivers should be aware that while active video games are a good way to break up sedentary time (e.g., sitting on the couch), they are not as good as playing real active games or sports (see “Active Healthy Kids Canada’s Position on Active Video Games” on page 23).
Research Gaps Physical Activity Levels – Active Play & Leisure • More research is needed on how to accurately measure active play. • The development of an active play target or benchmark is needed in order to assess whether children are getting sufficient amounts of active play. • Research is needed on how to promote greater independent mobility among children so that they have more freedom to safely travel and play without adult supervision. • More research is needed on the determinants and health outcomes of active play because these may be different than they are for other forms of physical activity.
2013 Grade D Active Transportation Benchmark Physical Activity Levels – Active Transportation % of children who use active transportation to get to and from places (e.g. school, park, mall, friend’s house)
Key Findings Physical Activity Levels – Active Transportation
Recommendations • School Travel Planning (STP) is a multidisciplinary, multi-sectoral, school-specific intervention that engages key stakeholders (e.g., STP facilitators, public health professionals, police officials, municipal planners and traffic engineers, school boards, parents, children, school administrators and teachers) in the survey and evaluation of school travel issues.66 All schools should develop a travel plan. Where appropriate, such plans should identify strategies to safely promote active school travel in the context of local barriers and facilitators. • Novel approaches for promoting active transportation in children living in suburban and rural areas should be developed and evaluated. • To prevent injuries, additional road safety measures and transportation policies should be implemented given that the built environments of many Canadian schools consist of poor infrastructure, programs and policies to support active transportation.67 Physical Activity Levels – Active Transportation
Recommendations • Municipal and provincial/territorial government departments that are responsible for land use planning should develop joint planning mechanisms and protocols to ensure that the built environment enables walking and biking to be an easy choice for children and youth. • Active transportation needs to be considered when new subdivisions and schools are being built, instead of being considered afterwards as a post-hoc arrangement. • Consider partnerships with local community organizations to promote active transportation to organized activities. Physical Activity Levels – Active Transportation
Recommendations • More research is needed to determine the effectiveness of interventions such as School Travel Planning68 in increasing school travel among children. Preliminary evidence suggests that these programs result in small increases in active transportation among children who live within walking distance of school (≤ 1.6 km). • There is a lack of available data regarding active transportation to/from destinations other than school by Canadian children and youth. This data would be helpful in clarifying the role of active transportation in promoting physical activity. For example, among British children, active transportation to parks and shops or to visit family and friends is associated with greater overall physical activity.69 • More research is needed to determine how various interventions can change attitudes as well as real and perceived barriers to independent mobility, which may be a necessary foundation for facilitating both active travel and play. Physical Activity Levels – Active Transportation
2013 Grade C Physical Education & Physical Activity Participation in School & Childcare Settings Benchmark School & Childcare Settings – Physical Education % of students who get a minimum of 150 minutes of physical education (PE) per week. % of students who are physically active at school outside of PE classes (e.g., intramurals, varsity sports, teams/clubs, recess).
Key Findings School & Childcare Settings – Physical Education
Key Findings • In 2010, 77% of parents reported that the school their children and youth (5- to 17-year-olds) attend offers programs outside of PE classes for sport and physical activity, which is an increase from 68% in 2000 (2010 PAM, CFLRI).82 • 52% of Ontario students in Grades 7 to 12 are physically active at school (2011 Ontario Student Drug Use and Health Survey [OSDUHS]).83 This percentage has been stable over time. • 52% of Grades 6 to 12 students across most Canadian provinces report participation in intramurals or school team sports (2010-11 YSS). School & Childcare Settings – Physical Education
Key Findings • 64% and 69% of Quebec students in Grades 5 to 11 report participation in competitive and non-competitive activities at school respectively (2010-11 Quebec en Forme [QEF]). • 9% of PEI students in Grades 6 to 12 report receiving at least 5 PE classes per week (2010-11 SHAPES-PEI). • 47% of PEI students in Grades 6 to 12 report participating in physical activities organized by their school (e.g., intramurals, non-competitive clubs) before school, at noon and/or after school (2010-11 SHAPES-PEI). School & Childcare Settings – Physical Education
Recommendations • Higher levels of enjoyment are associated with higher levels of physical competence in PE, suggesting the need to create interventions and environments that provide the opportunity for students to master an activity. • Compliance with PE policies creates more school-based physical activity opportunities. Increased support for and evaluation of compliance to PE policies and programs and support of uptake needs to be provided. • Improvements need to be made that create more purposeful play opportunities that break up sedentary time. Schools can help educate families to ensure weekend days have similar breaks in sedentary time as are happening at school. School & Childcare Settings – Physical Education
Research Gaps School & Childcare Settings – Physical Education • Surveillance data on the proportion of students getting a minimum of 150 minutes of PE per week are needed. • Better evidence is required to guide effective implementation of provincial/territorial and regional policy on PE. • Canada could benefit from evaluative research that demonstrates how physical activity opportunities in the school setting translate into higher step counts and MVPA.
Research Gaps School & Childcare Settings – Physical Education • More research is needed to identify barriers that keep school administrators and educators from successfully implementing PE policies, and how others have successfully navigated the challenges. Research also needs to clarify how to work with stakeholders to identify and implement solutions. • Objective assessments of physical activity and sedentary behaviour patterns in childcare settings are needed. • Research is needed on the factors that influence physical activity and break up sedentary time periods in childcare environments.
2013 Grade F Sedentary Behaviour Benchmark % of children and youth who meet the Canadian Sedentary Behaviour Guidelines • Limiting recreational screen time: • 2 years and under – no screen time • 3-4 year olds – no more than 1 hour/day • 5-17 year olds – no more than 2 hours/day • Limiting sedentary (motorized) transport, extended sitting and time spent indoors throughout the day. Sedentary Behaviour