Download
1 / 10
100 likes | 169 Views
SOURCE ATTRIBUTION OF MERCURY EXPOSURE FOR U.S. SEAFOOD CONSUMERS: IMPLICATIONS FOR POLICY. Noelle Eckley Selin Joint Program on the Science and Policy of Global Change Center for Global Change Science Massachusetts Institute of Technology AGU Fall Meeting 19 December 2008.

E N D
SOURCE ATTRIBUTION OF MERCURY EXPOSURE FOR U.S. SEAFOOD CONSUMERS: IMPLICATIONS FOR POLICY Noelle Eckley SelinJoint Program on the Science and Policy of Global Change Center for Global Change Science Massachusetts Institute of Technology AGU Fall Meeting 19 December 2008 Coauthors:E. M. Sunderland (Harvard), C. D. Knightes, (U.S. EPA), R. P. Mason (U. Conn.), S. Paltsev (MIT), J. M. Reilly (MIT), R. G. Prinn (MIT)
HOW DO POLICIES AFFECT EXPOSURE? Atmosphere [GEOS-Chem, Selin and Jacob, 2008] 1. Deposition and source attribution Marine pathway Freshwater pathway Ocean dynamics [Sunderland and Mason, 2007] 16% 20% Watershed/ Water body [Knightes et al., in press] 2. Policy and Timescale Analysis 4. Population-wide exposure 3. Local exposure 5. Economic implications [MIT EPPA model, Paltsev et al. 2006]
MODELS (1): ATMOSPHERE (GEOS-Chem) Global, 3D tropospheric chemistry model simulation, 4x5 degree resolution, assimilated meteorology [Bey et al., 2001] Provides wet and dry deposition (present-day) from: Natural sources (pre-industrial simulation) North American anthropogenic sources International anthropogenic sources Historical anthropogenic sources (“Legacy” mercury revolatilized from surface reservoirs) 1/3 1/3 1/3 [Selin et al., 2008; Selin and Jacob, 2008]
MODELS(2):WATERSHED/WATER BODY SERAFM: Lake model WASP7: River model WCS (MLM): Watershed loading BASS: Aquatic food web Models available from EPA (Athens) [Knightes et al., in press]
MODELS (3): OCEAN DYNAMICS 14 ocean basins (North Atlantic, Surface Atlantic, Mediterranean, North Pacific, etc.) MARINE BOUNDARY LAYER Cair kv ATMOSPHERIC DEPOSITION EVASION kO1 RIVERS RESERVOIR Mw = CwVw LATERAL OCEAN FLOW PARTICLE SETTLING DEEP WATER FORMATION kp kO2 [Sunderland and Mason, 2007]
1. DEPOSITION AND SOURCE ATTRIBUTION (FRESHWATER) Two freshwater deposition scenarios: “Northeast” and “Southeast” U.S. International Anthropogenic Pre-industrial + Historical 9% 32% N. American Anthropogenic 59% NE Total: 24.21 g m-2 y-1 23% 11% 66% % Deposition from North American sources [Selin and Jacob, 2008] SE Total: 34.08 g m-2 y-1
2. POLICY & TIMESCALE ANALYSIS (FRESHWATER) Each ecosystem driven by present-day deposition for 40 years (10-year spin up) Policy experiment: All Hg is “historical” at t=0. How is anthropogenic signal reflected in fish, and on what timescale? Same deposition,but different ecosystem dynamics lead to very different source attributions (and concentrations) over time Fish MeHg (ppm) Note difference in scale! Regional differences in deposition sources lead to different attributions in similar ecosystems Watershed/water body models: Knightes et al., in press; source attribution, Selin et al. in prep
3. LOCAL EXPOSURE (FRESHWATER)2 x 100 g fish meals/week (60 kg person) @ t=40 y 6.4 North American anthropogenic International anthropogenic Historical+Natural WHO intake threshold EPA Reference Dose Northeast Deposition Southeast Deposition
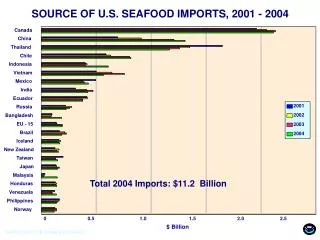
4. POPULATION-WIDE EXPOSURE (MARINE) Calculate exposure from each basin from commercial market statistics Historical exposure is continuing to increase, complicating policy decision-making “current emissions” scenario 14-box model: Sunderland and Mason, 2007; exposure by basin, Sunderland et al. in prep; Source attributions/exposure index: Selin et al., in prep
5. ECONOMIC IMPLICATIONS (MARINE) • MIT Emissions Prediction and Policy Analysis (EPPA) model • IQ deficits from mercury exposure [Axelrad, 2007] cost 2.5% of income per point lost [Salkever, 1995] • Calculate additional cost of US emissions for general population (marine) exposure beginning in 2000 Methodology takes into account “indirect” costs of lost investment/savings Other estimates: $1.3b for US power plants alone (Trasande et al., 2005); $119m-4.9b (Rice et al. 2005)