Download
1 / 7
70 likes | 239 Views
SOURCE OF U.S. SEAFOOD IMPORTS, 2001 - 2004. Canada. China. Thailand. Chile. Indonesia. Vietnam. Mexico. India. Ecuador. 2001. Russia. 2002. Bangladesh. EU - 15. 2003. Brazil. 2004. Iceland. New Zealand. Taiwan. Japan. Malaysia.

E N D
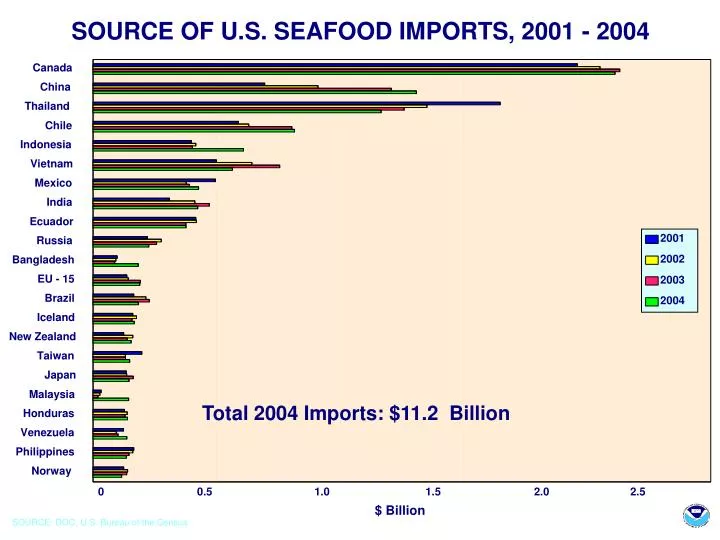
SOURCE OF U.S. SEAFOOD IMPORTS, 2001 - 2004 Canada China Thailand Chile Indonesia Vietnam Mexico India Ecuador 2001 Russia 2002 Bangladesh EU - 15 2003 Brazil 2004 Iceland New Zealand Taiwan Japan Malaysia Total 2004 Imports: $11.2 Billion Honduras Venezuela Philippines Norway 0 0.5 1.0 1.5 2.0 2.5 $ Billion SOURCE: DOC, U.S. Bureau of the Census
COMPOSITION OF MAJOR U.S. SEAFOOD IMPORTS, 2004 Groundfish 9.3% Crab 10.2% Salmon 10.4% Pat. Toothfish 0.8% Tuna 8.2% Scallops 1.4% Lobster 8.9% Squid 1.4% Other 12.3% Tilapia 3.0% Shrimp 34.2% Total Imports: $11.2 Billion SOURCE: DOC, U.S. Bureau of the Census
U.S. SEAFOOD SUPPLY AND DEMAND: PAST AND PROJECTED (Round Weight) Million MT 16 14 Demand based on new dietary guidelines: 2 (4 oz.) seafood meals per week 12 10 Demand = Per capita consumption x population 8 6 U.S. Harvest 4 2 U.S. Supply = Harvest - Exports 0 - 1985 1990 1995 2000 2005 2010 2015 2020 2025
VALUE OF U.S. SEAFOOD EXPORTS AND IMPORTS 1984 - 2004 $ Billion 12 10 8 6 4 2 0 84 85 86 87 88 89 90 91 92 93 94 95 96 97 98 99 00 01 02 03 04 SOURCE: DOC, U.S. Bureau of the Census Exports Imports
VOLUME OF U.S. SEAFOOD EXPORTS AND IMPORTS, 1984 - 2004 1000 mt 2,000 1,500 1,000 500 0 1984 85 86 87 88 89 90 91 92 93 94 95 96 97 98 99 00 01 02 03 04 Exports Imports SOURCE: DOC, U.S. Bureau of the Census
U.S. Shrimp Landings, Imports, and Market Share Million Pounds Percent 1400 50 1200 40 1000 Imports 30 800 600 20 U.S. Market Share 400 10 200 Landings 0 0 '80 81 82 83 84 85 86 87 88 89 '90 91 92 93 94 95 96 97 98 99 '00 '01 '02 Percent U.S. Market Share Landings Imports