Download
1 / 12
120 likes | 259 Views
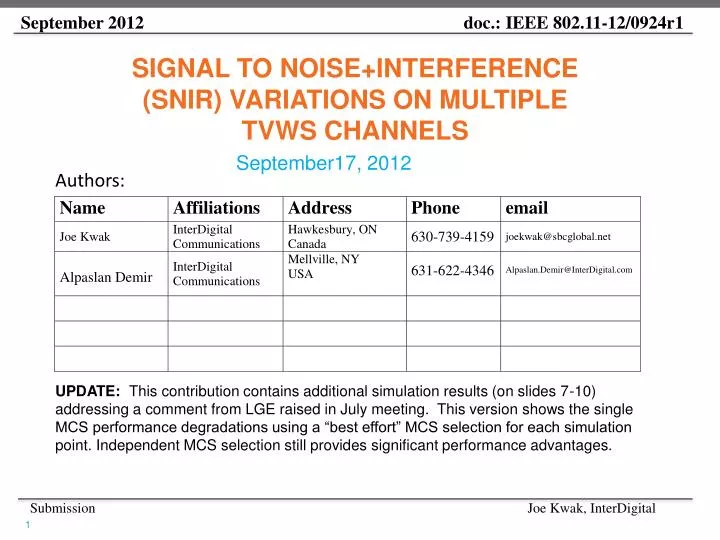
Signal to Noise+Interference (SNIR) Variations on multiple TVWS channels. Authors:. September 17, 2012.

E N D
Signal to Noise+Interference (SNIR) Variations on multiple TVWS channels Authors: September17, 2012 UPDATE: This contribution contains additional simulation results (on slides 7-10) addressing a comment from LGE raised in July meeting. This version shows the single MCS performance degradations using a “best effort” MCS selection for each simulation point. Independent MCS selection still provides significant performance advantages.
Interference Scenarios Highly Changeable SNIRs on Aggregated TVWS Channels • Interference components of TVWS channels • The interference level difference may be as much as 15 dB among TVWS channels [3], and even up to 30db when close to DTV transmitter [1].
Cambridge TVWS Trial Results • Cambridge trial results [4] show significant spectrum quality difference between TVWS Channels 59 and 61 • Location dependent difference in channel quality • High interference level from Tacolneston transmission presents on Channel 59 • Channel 61 exhibits interference from Waltham 6dB lower than Channel 59 Fig. 15 of [4]: distinct achieved throughputs due to unequal interference levels
Main factors impacting SNIR of TVWS channels [5] • Allowable transmit power for a given type of TVWS device • Location and channel dependency • Up to 4dB variation of transmit power/5MHz band on different type of channel (adjacent vs. non-adjacent). • May cause different desired signal levels on aggregated channels • Path loss dependency on operational frequency • Better propagation characteristics in the lower part of UHF bands than in the upper part • Level of interference and noise • Interference from DTV signal on adjacent channels FCC Power spectrum density (PSD) requirement [6]
DTV Adjacent Channel Leakage Level (chan. N±1) • According to the Figure provided above in reference [12] • The first adjacent channel OOBE is calculated to be roughly -55 dBc • For instance, if the DTV occupied channel power measured at the TVBD receiver antenna port is at -28 dBm (e.g. 25km from WBFF in Baltimore) • The first adjacent channel OOBE level is -83 dBm = (-28 -55) dBm • If DTV Tx filter has 3 dB margin, then first adjacent OOBE power becomes -86 dBm • This produces TVWS SNIR variance as high as 35 db close to DTV transmitters.
Multichannel operation requires independent MCS selection • Assumptions: • DTV operated on Channel N • DTV out-of-band emission to Channel N+1 = -86dBm [7]; no DTV leakage to Channel N + 4 • Aggregation of Channel N+1 and Channel N+4 for TVBD communication • Thermal Noise PSD = -174 dBm/Hz, Noise Figure = 5dB • 1 Tx Antenna, 2 Rx Antenna (chosen for simplicity) • Target PER = 10 % • MCS Selection in reference to 40MHz [8] • Path Loss Model @ f = 600MHz [9] • Channel Model E, e.g. large office • Total Tx power for Portable TVBD = 20 dBm • 20 dBm = TxPowN+1(16dBm) + TxPowN+4(17.5dBm) • No antenna gain
UDP Throughput Analysis Assumed Parameters (unit: µs) • Assumptions • Operation timeline is down clocked by a factor 7.5 [10] • Block ACK used in TXOP • BA: 24 bytes, BAR: 32 bytes(compressed bitmap) • Access Category: Video • One PPDU includes preamble, overhead and data • DATA length = 1000 bytes • Overhead (service filed, MAC, IP, etc) = 45 bytes • Preamble time = 40 * 7.5 = 300 µs • MAC layer aggregation • UDP Throughput calculation • Total time used for one packet transmission: T_PPDU = PreambleTime + MACOverhead+ Data + RIFS • Number of PPDUs transmitted within one TXOP: N_PPDU = (TXOP – SIFS – BAR - BA )/T_PPTU • Throughput for a channel = N_PPDU * DATA_LENGTH * ( 1 – PER ) * 8 bits/(ContentionPeriod + TXOP) • PER selection is based on the averaged SINR [8] • Total Throughput = (Tput for Channel N+1)+ (Tput for Channel N+4) QoS Data Access and Data Transmission with Block ACK in MAC Layer Aggregation
Numerical Results (1/2) • Four cases are investigated: • Independent MCS selection: MCS selection based on each channel SINR • Single MCS schemes: common MCS applied in aggregated channels • Max MCS selection: Higher MCS among two channels used for both channels • Min MCS selection: Lower MCS among two channels used for both channels • Best Intermediate MCS selection: • When there is more than one MCS value between Min and Max, the MCS between Min and Max to achieve the highest throughput is applied on both channels • When there is no MCS between Min and Max, Max MCS is used for both channels
UDP Throughput Gains from Independent MCS Selection • Independent MCS selection provides the best UDP throughput performance • In the larger coverage range (e.g., ≥170m), the total throughput is dominated by the better channel • Independent MCS selection offers less gains over Max MCS selection • Min MCS selection provides much lower throughput due to the conservative selection • For high SINR cases (e.g., d ≤ 70m), all selection methods lead to the same MCS selection on both channels and similar PER performance, thus similar throughput • Best intermediate MCS selection favors • The MCS closer to the minimum MCS in middle distances (e.g., 80-140m) • The MCS closer to the maximum MCS in large distances (e.g., >140m) • Larger TCP throughput gain would be expected
Summary • Highly variable SNIR levels on aggregated TVWS channels: • Different received power on different TVWS bands/channels • High variance fixed and dynamic interference environment, especially on DTV adjacent channels • Single MCS utilization for multichannel leads to significant degradation and waste of spectrum • Independent MCS for multichannel permits efficient use of resources in real TVWS environments. • TGaf draft requires use of single MCS for multichannel and needs to be changed to permit effective multichannel operation using independent MCS selection.
References • [1] Neul, “Using White Space for M2M”, Weightless, June 2011 • [2] Jaap van de Beek, JanneRiihijärvi, Andreas Achtzehn and Petri Mähönen, “TV white space in Europe”, IEEE Trans. On Mobile computing, vol. 11, no. 2, pp. 178-188, Feb. 2012 • [3] MubaraqMishra, AnantSahai, “How much white space is there?” Department of Electrical Engineering and Computer Science, UC Berkeley, Tech. Rep. EECS-2009-3,Jan. 2009 • [4] “Cambridge TV white spaces trial: a summary of the technical findings,” 2012 Cambridge White Spaces Consortium • [5]“Recommendations from implementing the use of white spaces: conclusions from Cambridge TV White Spaces Trials”, 2012 Cambridge White Spaces Consortium • [6] FCC-12-36A1 Third Order, April, 2012 • [7] Hou-Shin Chen and WenGao, “Spectrum sensing for FM wireless microphone signals,” in IEEE DySPAN 2010, Singapore, April, 2010 • [8] “Joint proposal team PHY simulation results,” IEEE 802.11-06/0067r02 • [9] EldadPerahia and Robert Stacey, Next Generation Wireless LANs – Throughput, Robustness, and Reliability in 802.11n, Cambridge, 2010 • [10] Bcom/Qcom,11-12-0699-00-00af-revised-phy-proposal • [11] TGaf PHY proposal, IEEE 802.11-12/0809r0 • [12] ATSC Recommended Practice: Transmission Measurement and Compliance for Digital Television Document A/64B, 26 May 2008