Download
1 / 136
1.36k likes | 1.63k Views
2.2 . Transforming the Balanced Scorecard from Performance Measurement to Strategic Management : Part 1. 從績效評估轉換平衡計分卡的策略管理 第一部分. 學生 : Ma0a0204 王詩婷. Ma0a0101 葛雅婷. Ma0a0105 陳欣妤.

E N D
2.2 Transforming the Balanced Scorecard from Performance Measurement to Strategic Management : Part 1 從績效評估轉換平衡計分卡的策略管理 第一部分 學生: Ma0a0204 王詩婷 Ma0a0101 葛雅婷 Ma0a0105 陳欣妤
Several years ago we introduced the Balanced Scorecard (Kaplan and Norton 1992). We began with the premise that an exclusive reliance on financial measures in a management system is insufficient. 幾年前,我們推出平衡記分卡(Kaplan和Norton,1992)一開始,我們完全的依賴管理系統中的財務措施是不夠的。 Financial measures are lag indicators that report on the outcomes from past actions. Exclusive reliance on financial indicators could promote behavior that sacrifices long-term value creation for short-term performance 財務措施是延遲指標,是報告從過去的行為所得之成果。完全依賴財務指標會造成犧牲短期業績的長期價值創造行為。(Porter 1992; AICPA 1994)
The Balanced Scorecard approach retains measures of financial performance - the lagging outcome indicators - but supplements these with measures on the drivers , the lead indicators , of re financial performance. 平衡計分卡此方法是種衡量,財務績效-落後指標,但補充這些衡量的意見使用者,為主要指標,是對未來的財務績效。
The Balanced Scoredcad Emerges 平衡計分卡的出現
The limitations of managing solely with financial measures , however , have been known for decades. What is different now? Why has the Balanced Scorecard concept been so widely adopted by manufacturing and service companies , nonprofit organizations , and government entities around the world since its introduction in 1992? 然而,管理財務措施局限性,已經知道幾十年。現在有什麼不同?為什麼平衡計分卡的概念自1992年推出以來在世界各地被廣泛採用,在製造業和服務業公司,非營利組織和政府機構?
First , previous systems that incorporated nonfinancial measurements used ad hoc collections of such measures , more like checklists of measures for managers to keep track of and improve than a comprehensive system of linked measurements. 然而,首先,以前的系統,納入非金融的測量,使用特設集合的措施,類似經理人核對清單的措施,一個完整的連結測量系統措施,更保持跟蹤和改善。
The Balanced Scorecard emphasizes the linkage of measurement to strategy ( Kaplan and Norton 1993) and the cause-and-effect linkages that describe the hypotheses of the strategy ( Kaplan and Norton 1996b). The tighter connection between the measurement system and strategy elevates the role for nonfinancial measures from an operational checklist to a comprehensive system for strategy implementation (Kaplan and Norton 1996a ). 平衡計分卡強調連動策略測量(Kaplan和Norton,1993年),原因和結果之間的聯繫,描述了假設的策略(Kaplan和Norton1996年)。測量系統和策略之間的緊密連接,提升非財務措施的作用,從操作的核對清單到全面系統的策略執行(Kaplan和Norton1996年)。
Second, the Balanced Scorecard reflects the changing nature of technology and competitive advantage in the latter decades of the 20th century. In the industrial-age competition of the 19th and much of the 20th centuries, companies achieved competitive advantage from their investment in and management of tangible assets such as inventory, property, plant, and equipment (Chandler 1990). 第二,平衡計分卡在20世紀後幾十年的技術和競爭優勢反映了不斷變化的性質。在19世紀和20世紀大部分工業時代的競爭,企業取得競爭優勢,從他們的投資及管理等有形資產,例如,存貨、物業、廠房及設備(Chandler 1990)。
In an economy dominated by tangible assets, financial measurements were adequate to record investments on companies' balance sheets. Income statements could also capture the expenses associated with the use of these tangible assets to produce revenues and profits. 在以有形資產為主的經濟,財務測量適當的記錄投資公司的資產負債表上。收入報表,還可以捕獲使用這些有形資產,產生的收入和利潤相關的費用。
But by the end of the 20th century, intangible assets became the major source for competitive advantage. In 1982, tangible book values represented 62% of industrial organizations' market values; ten years later, the ratio had plummeted to 38% ( Blair 1995). 但到了20世紀的結束,無形資產成為競爭優勢的主要來源。1982年,產業組織的市場價值,有形資產帳面價值62%,10年後,這個比例下跌至38%( Blair 1995)。
By the end of the 20th century, the book value of tangible assets accounted for less than 20% of companies' market values (Webber 2000, quoting research by Baruch Lev). Clearly, strategies for creating value shifted from managing tangible assets to knowledge-based strategies that create and deploy an organization's intangible assets. 20世紀的結束,公司的市場價值,有形資產的帳面價值佔不到20%,(Webber 2000, quoting research by Baruch Lev)。顯然,創造價值的策略轉移,從有形資產管理,到以知識為基礎的策略,創建和部署一個組織的無形資產。
These include customer relationships, innovative products and services, high-quality and responsive operating processes, skills and knowledge of the workforce, the information technology that supports the work force and links the firm to its customers and suppliers, and the organizational climate that encourages innovation, problem-solving, and improvement. 這些措施包括客戶關係,創新的產品和服務,高品質和響應的操作流程,技能和知識的勞動力,信息技術支持的工作力量和連接該公司為客戶和供應商,並鼓勵創新的組織氣候,問題解決和改進。
But companies were unable to adequately measure their intangible assets (Johnson and Kaplan 1987, 201-202). Anecdotal data from management publications indicated that many companies could not implement their new strategies in this environment (Kiechel 1982; Charan and Colvin 1999). They could not manage what they could not describe or measure. 但公司未能充分衡量其無形資產(Johnson and Kaplan 1987, 201-202)。傳聞管理刊物的數據表明,在這樣的環境中,許多公司無法實現其新的策略(Kiechel 1982; Charan and Colvin 1999)。他們不能管理他們無法描述或測量
Intangible assets: Valuation VS. Value Creation 無形資產:評估 VS. 創造價值
Some call for accountants to make an organization's intangible assets more visible to managers and investors by placing them on a company's balance sheet. But several factors prevent valid valuation of intangible assets on balance sheets. 有些人呼籲會計師對於無形資產的編制,被管理者和投資者將它們放置在公司的資產負債表,使報表能更清楚明白。但有幾個因素阻礙了資產負債表上的無形資產有效的評估。 First, the value from intangible assets is indirect. Assets such as knowledge and technology seldom have a direct impact on revenue and profit. 第一:來自無形資產的價值是間接的。知識和技術等資產很少有直接影響收入和利潤。
Improvements in intangible assets affect financial outcomes through chains of cause-and-effect relationships involving two or three intermediate stages ( Huselid 1995; Becker and Huselid 1998). For example, consider the linkages in the service management profit chain ( Heskett et al. 1994). 無形資產的改善會影響財務結果,透過綜效的原因及結果的關係,其中包含兩個或三個中間環節( Huselid 1995; Becker and Huselid 1998)。例如,考慮服務管理利潤中的關聯( Heskett et al. 1994)。
investments in employee training lead to improvements in service quality • better service quality leads to higher customer satisfaction • higher customer satisfaction leads to increased customer loyalty • increased customer loyalty generates increased revenues and margins • 員工培訓的投資,提升服務品質的改善 • 更好的服務品質會提高的客戶滿意度 • 更高的客戶滿意度提高客戶忠誠度 • 提高客戶忠誠度會讓產生收入和利潤增加
Financial outcomes are separated casually and temporally from improving employees' capabilities. The complex linkages make it difficult, if not impossible, to place a financial value on an asset such as work force capabilities or employee morale, much less to measure period-to-period changes in that financial value. 財務績效從提升員工的能力被暫時的隔開。該財務價值複雜且很困難,但並非不可能,財務價值的資產,如工作隊伍的能力或員工的士氣,更談不上測量週期到週期的變化。
Second, the value from intangible assets depends on organizational context and strategy. This value cannot be separated from the organizational processes that transform intangibles into customer and financial outcomes. 第二:無形資產的價值取決於公司組織環境和策略。此價值不能跳脫公司組織,把無形資產的價值轉換為客戶和財務成果。 The balance sheet is a linear, additive model. It records each class of asset separately and calculates the total by adding up each asset's recorded value. The value created from investing in individual intangible assets, however is neither linear nor additive. 資產負債表是線性的,為相加模型。其記錄了每類資產分別計算,每個資產增加的總入帳價值。從個別無形資產投資所創造的價值,既不是線性,也不是相加模型。
Senior investment bankers in a firm such as Goldman Sachs are immensely valuable because of their knowledge about complex financial products and their capabilities for managing relationships and developing trust with sophisticated customers. 資深投資銀行家在像Goldman Sachs這樣的公司是非常有價值的,因為他們的知識,複雜的金融產品和自己的能力與先進的客戶關係管理和建立信任。 People with the same knowledge, experience, and capabilities, however, are nearly worthless to a financial services company such as etrade.com that emphasizes operational efficiency, low cost, and technology-based trading. 然而,相同的知識,經驗和能力的人,幾乎是一文不值的金融服務公司,如etrade.com,其強調經營效率,成本低,技術為基礎的交易。
The value of an intangible asset depends critically on the context-the organization, the strategy, and other complementary assets-in which the intangible asset is deployed. Intangible assets seldom have value by themselves. Generally, they must be bundled with other intangible and tangible assets to create value. 無形資產的價值取決於嚴格的背景下組織、策略、和其他互補性資產中的無形資產。無形資產很少有自己的價值。一般情況下,他們必須與其他無形及有形資產捆綁在一起,創造價值。
For example, a new growth-oriented sales strategy could require new knowledge about customers, new training for sales employees, new data-bases, new information systems, a new organization structure, and a new incentive compensation program. 例如,以增加為導向的新銷售策略可能包含客戶、培訓新銷售員工、新的數據基礎、新的資訊系統、一個新的組織結構和新的薪酬激勵計畫有關的新知識。
Investing in just one of these capabilities, or in all of them but one, could cause the new sales strategy to fail. The value dose not reside in any individual intangible assets. It arises from creating the entire set of assets along with a strategy that links them together. The value-creation process is multiplicative, not additive. 投資於這些功能其中的一個或所有,但只有一個,可能會導致新的銷售策略失敗。價值量,不留在任何個別的無形資產。它的出現是連結在一起的策略,創造了整套資產。此價值創造過程為乘法模型,並非加法模型。
The Balanced Scorecard Supplements Conventional Financial Reporting 平衡計分卡補充傳統的財務報告
Companies' balance sheets report separately on tangible assets, such as raw material, land, and equipment, based on their historic cost-the traditional financial accounting method. This was adequate for industrial-age companies, which succeeded by combining and transforming their tangible resources into products whose value exceeded their acquisition and production costs. 公司的資產負債表分別,有形資產,如原材料、 土地和設備,基於其歷史成本,為傳統財務計算方式的報告。這是適合的工業革命時代的公司,成功透過組合並將其有形資源轉變為其價值超過其購買和生產成本的產品。
Financial accounting conventions relating to depreciation and cost of goods sold enabled an income statement to measure how much value was created beyond the costs incurred to acquire and transform tangible assets into finished products and services. 有關財務會計的常規,出售折舊和產品成本損益作為衡量,有多少價值被創造,所產生的成本能獲取和將有形資產轉換為產品和服務。
Some argue that companies should follow the same cost-based convention for their intangible assets-capitalize and subsequently amortize the expenditures on training employees, conducting research and development, purchasing and developing databases, and advertising that creates brand awareness. 有些人認為,企業應該遵循相同的,以成本為基礎的常規,其無形資產資本化,其後攤銷支出、員工培訓、進行研究和開發、採購和發展數據庫、並建立品牌知名度的廣告。
But such costs are poor approximations of the realizable value created by investing in these intangible assets. Intangible assets can create value for organizations, but that does not imply that they have separable market values. Many internal and linked organizational processes, such as design, delivery , and service, are required to transform the potential value of intangible assets into products and services that have tangible value. 但這種費用是由這些無形資產投資創建的可變現價值的近似值。無形資產創造價值的組織,但這並不意味著他們有可分離的市場價值。許多內部和連結的組織過程如設計、 交付和服務,需要將無形資產的潛在價值轉化為產品和服務的有形價值。
We introduced the Balanced Scorecard to provide a new framework for describing value-creating strategies that link intangible and tangible assets. The scorecard does not attempt to "value" an organization's intangible assets, but it does measure these assets in units other than currency. 我們介紹了平衡計分卡為描述連結的有形資產和無形資產的價值創造策略,提供一個新的架構。平衡計分卡不會改變〝價值〞組織的無形資產,但它不能衡量這些資產以外的貨幣單位。
The Balance Scorecard describes how intangible assets get mobilized and combined with intangible and tangible assets to create differentiating customer-value propositions and superior financial outcomes. 平衡計分卡描述如何流通無形資產,無形資產和有形資產結合,以創造差異化的客戶價值主張和優異的財務結果。
Strategy Maps 策略地圖
Since introducing the Balanced Scorecard in 1992, we have helped over 200 executive teams design their scorecard programs. Initially we started with a clean sheet of paper, asking, "what is the strategy," and allowed the strategy and the Balanced Scorecard to emerge from interviews and discussions with the senior executives. The scorecard provided a framework for organizing strategic objectives into the four perspectives displayed in Figure 1: 自1992年引入平衡計分卡,我們已經幫助200餘團隊設計好自己的計分卡計劃。最初,我們最初的問〝什麼是策略〞讓高層行政人員的策略和平衡計分卡所產生的訪談和討論。計分卡提供了一個架構顯示在圖 1 中的四個觀點組織策略目標:
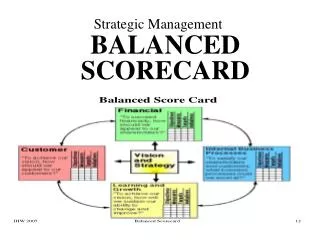
FIGURE.1 THE BALANCED SCORECARD DEFINES A STRATEGY'S CAUSE-AND EFFECT RELATIONSHIPS 圖一 平衡計分卡的定義交易策略原因和結果關係
Vision and Strategy 願景與策略 Financial Perspective Measures Targets Initiatives Objectives “IF we succeed, how will we look to our shareholders?” 財務構面 量度 指標 目標 行動 為了成功地獲取資金,應如何面對我們的股東?
Customer Perspective Measures “To achieve my vision, how must I look to my customers?” Targets Initiatives Objectives 顧客構面 量度 行動 指標 目標 為了達成願景應如何面對的顧客?
Internal Perspective Measures Targets Initiatives “To satisfy my customers, at which processes must I excel?” Objectives 內部營運流程 量度 指標 為了滿足股東與顧客,必須採取什麼樣的企業程序? 目標 行動
Learning & Growth “To achieve my vision, how must my organization learn and improve?” Measures Targets Initiatives Objectives 學習與成長 量度 行動 指標 目標 為了達成願景應如何持續地改變及進步?
Financial-the strategy for growth , profitability, and risk viewed from the perspective of the shareholder. Customer-the strategy for creating value and differentiation from the perspective of the customer. Internal Business Processes-the strategic priorities for various business processes that create customer and shareholder satisfaction. Learning and Growth-the priorities to create a climate that supports organizational change, innovation, and growth. 財務策略-從股東的角度來看待,增加、盈利能力和風險。 客戶-從客戶的角度,用於創造價值和差異化的策略。 內部業務流程 -對各種業務流程,創造客戶和股東滿意度的策略重點。 學習與成長-創造一個環境、支持組織變革、創新和增加的優先次序。
From this initial base of experience, we subsequently developed a general framework for describing and implementing strategy that we believe can be as useful as the traditional framework of income statement, balance sheet, and statement of cash flows for financial planning and reporting. The new framework, which we call a "Strategy Map," is a logical and comprehensive architecture for describing strategy, as illustrated in Figure 2. A strategy map specifies the critical elements and their linkages for an organization's strategy. 從這個初步的經驗基礎,接著,我們開發了一個通用的架構來描述和實施策略,相信可以作為有用的損益表、資產負債表及現金流量表,財務規劃和報告表的傳統架構。新的架構,我們稱之為〝策略地圖〞,是用於描述策略,邏輯和全面的架構,如圖 2 所示。策略地圖指定的關鍵要素和他們組織的策略之間的連結。
FIGURE.2 THE BALANCED SCORECARD STRATEGY MAP 圖二 平衡計分卡 策略地圖
Objectives for growth and productivity to enhance shareholder value. • Market and account share, acquisition , and retention of targeted customers where profitable growth will occur. • Value propositions that would lead customers to do more higher-margin business with the company. • 經濟增加和生產力,以提升股東價值的目標。 • 市場和客戶佔有率、獲取和保留目標客戶,可能將使盈利增加。 • 將導致客戶做更多的高獲利率業務與公司的價值主張。
Innovation and excellence in products, services, and processes that deliver the value proposition to targeted customer segments, promote operational improvements, and meet community expectations and regulatory requirements. • Investments required in people and systems to generate and sustain growth. • 創新和卓越的產品、服務和對目標的客戶群,提供價值主張促進業務的改善,並滿足社會的期望和管理法規要求。 • 在人員和系統產生並維持經濟增加所需的投資
By translating their strategy into the logical architecture of a strategy map and Balanced Scorecard, organizations create a common and understandable point of reference for all organizational units and employees. Organizations build strategy maps from the top down, starting with the destination and then charting the routes that lead there. Corporate executives first review their mission statement, why their company exists, and corn values, what their company believes in. 通過策略轉換為策略地圖和平衡計分卡的邏輯架構,組織和員工建立一個共同和可以理解的參考點。組織建立策略地圖,從上到下開始與目標,然後圖表帶路的路線。他們的公司認為,公司高管首先回顧他們的使命及聲明,傳播其價值觀,相信公司存在的價值。
From that information, they develop their strategic vision, what their company wants to become. This vision creates a clear picture of the company's overall goal, which could be to become a top-quartile performer. The strategy identifies the path intended to reach that destination. 根據這些信息,他們開發自己的策略願景,他們的公司想要成為什麼。這一願景創造公司的清楚的整體目標,這可成為最高的四分之一服務表現。該策略確定了到達目標的途徑。
The typical destination for profit-seeking enterprises is a significant increase in shareholder value ( we will discuss the modifications for nonprofit and government organizations later in the paper). Companies increase economic value through two basic approaches-revenue growth and productivity. 追求利潤的企業典型的目標是大幅度增加股東價值(我們將在本文後面討論修改為非營利組織和政府機構)。公司增加經濟價值,通過兩個基本方法,收入增長和生產率。
A revenue growth strategy generally has two components: build the franchise with revenue from new markets, new products, and new customers; and increase sales to existing customers by deepening relationships with them, including cross-selling multiple products and services, and offering complete solutions. 收入增加策略一般由兩部分組成: 建立特許經營權的收入來自新市場、新產品、新客戶;通過加深與他們的關係,增加對現有客戶的銷售收入,包括交叉銷售多種產品和服務,並提供完整的解決方案。
A productivity strategy also generally has two components: improve the cost structure by lowering direct and indirect expenses; and utilize assets more efficiently by reducing the working and fixed capital needed to support a given level of business. 生產力策略一般也由兩部分組成: 改善成本結構,透過降低直接費用和間接費用;更有效地利用資產,透過減少支出給予的同業標準所需要的工作和固定資本。