Download
1 / 25
300 likes | 887 Views
Using Strategy Map and Balanced Scorecard to Assess Information Security Performance. 05 March 2009 Li–Hsiang Chiu (labrador@icst.org.tw) TWNCERT. Agenda. Background Security Metrics, Strategy Map and Balanced Scorecard Information Security Strategy Map and Balanced Scorecard Case Study

E N D
Using Strategy Map and Balanced Scorecard to Assess Information Security Performance 05 March 2009 Li–Hsiang Chiu (labrador@icst.org.tw) TWNCERT
Agenda • Background • Security Metrics, Strategy Map and Balanced Scorecard • Information Security Strategy Map and Balanced Scorecard • Case Study • Conclusion • Future Works • Q&A
Background • TWNCERT( also known for ICST) helps RDEC provide various information security services for Taiwan government agencies • ICST helps government agencies detect malware and provide suggestion to neutralized the impact Note: 1. ICST ( Information & Communication Security Technology Center) 2. RDEC (Research, Development and Evaluation Commission, Executive Yuan)
Background (Cont.) • But ICST has been found out that the same cause of security incident happens over and over again • ICST faces the increasing challenges from the clients : • What is the root cause of security incidents? • How to identify potential security problems? • Any consistent assessments?
Background (Cont.) security metrics Integrate & Modify Strategy map Balanced Scorecard • ICST launches new service call “ Information Security Health Check (ISHC)” Information Security Health Check (ISHC)” Assess IS posture overview IS performance assessment • Identifying critical activities related to IS • Measuring objectively • Presentingquantitatively
Security Metrics • Written by Andrew Jaquith • Security metrics is quantitative measure of the action that organization takes to reduce the risk or the effectiveness of various components of their security programs .
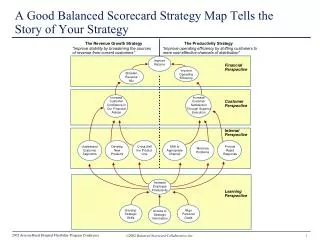
Strategy Map • Introduced by Robert S. Kaplan and David P. Norton • Strategy Map (SM) • You cannot measure what you cannot describe • Describe strategy prior to constructing metrics to evaluate performance against their strategies • Identify critical activities (CA) and cause-effect relationship • Earlier been a part of the process of constructing the balanced scorecard
Strategy Map-Example Long-term shareholder value long-term shareholder value Long-term shareholder value increasing new product market share strategy Increasing new product market share strategy Increasing new product market share strategy lowering cost strategy Lowering cost strategy Annual net income increase profit Annual net income Annual net income Annual net income Annual net income Financial perspective income from new product sale Income form selling new product Income form selling new product Decease total cost decease cost Income form selling new product Income form selling new product Income form selling new product Decease total cost Increase customer royalty Increase customer royalty Increase customer royalty Increase customer royalty Increase customer royalty decrease customer complain decrease customer complain decrease customer complain Customer perspective Increase customer royalty Increase customer royalty Increase customer royalty Increase customer royalty Increase customer royalty Increase customer royalty Increase customer royalty Increase customer royalty decrease customer complain decrease customer complain decrease customer complain decrease customer complain decrease customer complain decrease customer complain decrease customer complain decrease customer complain decrease customer complain zero defect manufacturing decrease product R&D time Internal Process perspective Learning & Growth perspective Well train employee well train employee Well train employee Well train employee Well train employee Well train employee Well train employee good working surrounding Good working surrounding Good working surrounding Good working surrounding Good working surrounding
Balanced Scorecard • Balanced Scorecard (BSC) • You can not manage what you can not measure • Provide organizations with metrics against which to measure their success • Measure whether activities of a company are aligned with its strategy • Provide a more comprehensive view of a business
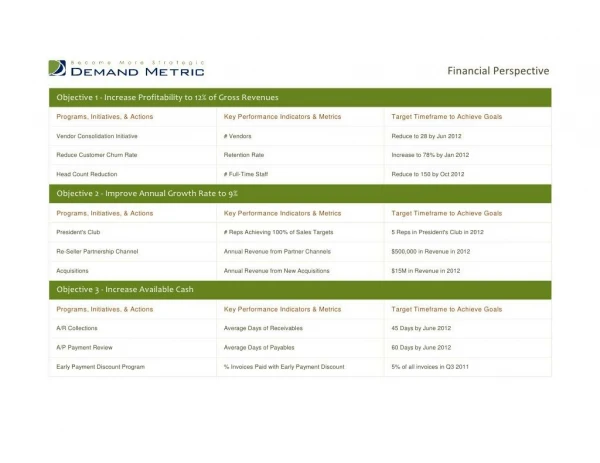
Balanced Scorecard-Example Financial perspective Customer perspective Internal Process perspective Internal Process perspective Perspective Critical activity KPI Driving Factor annual income annual net income increase annual profit annual cost income form selling new product income form selling new product annual income from selling new product decease cost annual cost manufacturing cost increase customer royalty customer retention rate amount of new customer increase customer satisfaction return rate number of return decrease R&D time delayed time of R&D average time of delay zero defect manufacturing defect rate number of defect during manufacturing well train employee education budget education budget per employee good working surrounding employee satisfaction employee satisfaction survey
Before Diving Into Following Discussion… • Strategy map identifies CAs and cause-effect relationship • Strategy map can help us using limited resources effectively and efficiently • BSC constructs performance measuring system. • Lots of practical security metrics already in place without starting from scratch
IS Performance Assessment Cycle Design Information Security Balanced scorecard Draw InformationSecurity Strategy Map Assessinformation Security Performanceand monitor Define IS Strategy Goals
Information Security Strategy Map • Design IS SM: • Step 1 :IS goal • Step 2: IS strategy • Step 3: IS perspective & critical activities • Step4: causality between IS critical activities.
Information Security Strategy Map – Simple Example Securing perimeter strategy Increasing new product market share strategy Increasing new product market share strategy fast response strategy Lowering cost strategy resist attack from outside and fast response to incidents IS requirement perspective decrease exposed avenue for attacks reduce incident response time endpoint security perimeter network security IS protection technology perspective IS management system perspective IS management system awareness & support perspective end-user awareness high-level management support information security worker’s awareness and competences
IS Balanced Scorecard • Based on built IS SM, depict IS BSC. • IS BSC • Lagging factor ( known for KPI) & driving factor • Borrow known security metrics instead start from scratch
IS Balanced Scorecard – Simple Example IS requirement perspective IS protection technology perspective IS management system perspective awareness & support perspective Perspective Critical Activity KPI Driving Factor successful attack decrease exposed avenue for attacks penetration testing severity incident response time reduce incident response time security incident drill incident handling time antivirus update rate endpoint security patch lagging time Perimeter network security Firewall ill-setting rule management system related to network auditing defect IS Management system management system related to incident response auditing defect management system related to endpoint protection auditing defect end-user awareness end-user awareness level average questionnaire rank high-level management support support level average questionnaire rank average questionnaire rank information security worker awareness & competences awareness & competence level
Measurement Hierarchical calculation calculation calculation calculation calculation 6
Data Normalization calculation calculation calculation calculation calculation Average time of patch lagging (driving factor) 6
Data Normalization-Example • Security incident drill ( KPI) = incident response time ( driving factor) × incident handling time ( driving factor)
Case Study • Pick a government agency as guinea pig! • Background • Technology-oriented, provides technical services to government agencies • Consider as ace amount government agencies in IS • ISO 27002 certificated • Deploy array of security detection and protection equipments
Case Study ( Cont.) • Collect data and complete IS BSC • Surprisingly, we found lots of serious problems! • From technical perspective, we track the problem followed by predefined SM: • Found the web server had lots vulnerabilities • This web server is supposed to be off-lined • Interview with related staff, no one can answer who is responsible for this web server • Can not find any controls or policies about offline system
Case Study ( Cont.) • Radar chart tells lots of stories !
Conclusion • The proposed methodology takes multi-perspectives into account simultaneously to provide overview of IS performances. • The proposed methodology has several significant advantages: • Comprehensive • Objective • Quantitative • Manageable
Future Work • The proposed methodology is not robust yet, a large scale implementation is needed to tune up the design. • ISMS perspective can be transferred into IS management processes in light of having comprehensive view of IS management. • ICST has been researched a methodology called “ Information Security Maturity model” which is used for evaluating information security service processes. • This model can be substituted ISMS perspective and become a part of whole IS performance assessment methodology.