Download
1 / 44
440 likes | 686 Views
Determining Bird Collision Risk with Terminal Doppler Weather Radar (TDWR). Sidney A. Gauthreaux, Jr., Ph.D. Remote Sensing and Technology Geo-Marine, Inc. Bird Aircraft Collisions (BAC).

E N D
Determining Bird Collision Risk with Terminal Doppler Weather Radar (TDWR) Sidney A. Gauthreaux, Jr., Ph.D. Remote Sensing and Technology Geo-Marine, Inc.
Bird Aircraft Collisions (BAC) • The government's tally for all bird strikes in 2009 could reach or even exceed 10,000 for the first time – which would represent about 27 strikes every day. • There were at least 57 cases in the first seven months of 2009 that caused serious damage and three in which planes and a corporate helicopter were destroyed by birds. • At least eight people died in BACs, and six more were hurt.
Bird Aircraft Collisions (BAC) • Although the majority of BACs occur within the airport environment, serious collisions can occur away from the airport. • Several serious collisions took place miles away from airports in 2009:
Bird Aircraft Collisions (BAC) • Date: 15 January 2009 • Aircraft: A-320 • Airport: LaGuardia Intl. (NY) • Phase of Flight: Climb (2,900 AGL) • Effect on Flight: Engines shut down, landed in Hudson River • Damage: Aircraft destroyed • Wildlife Species: Canada goose • Comments from Report: During initial climb, aircraft had multiple bird strikes and lost thrust to both engines. Pilot ditched in the Hudson River less than 6 minutes after takeoff.
Bird Aircraft Collisions (BAC) • Date: 29 September 2009 • Aircraft: B-727-200 • Airport: Memphis Intl. (TN) • Phase of Flight: Approach (3,700’ AGL) • Effect on Flight: None • Damage: Windshield • Wildlife Species: Great egret • Comments from Report: The captain’s front window was struck and the inner window panel shattered. Both engines ingested birds but sustained no damage.
Bird Aircraft Collisions (BAC) • Date: 2 November 2009 • Aircraft: MD-90 • Airport: Phoenix Sky Harbor (AZ) • Phase of Flight: Climb (11,000’ AGL) • Effect on Flight: Precautionary landing • Damage: Fuselage • Wildlife Species: Western Grebe • Comments from Report: Bird hit top of aircraft and tore back 18 inches of the fuselage just above the right side flight deck eyebrow window. A second strike tore a big hole just below the co-pilot’s wing in front of the landing gear. These strikes activated the depressurization alarm. Aircraft returned to land
Bird Aircraft Collisions (BAC) • Date: 4 November 2009 • Aircraft: BE-99 • Airport: Phoenix Sky Harbor (AZ) 100 miles west • Phase of Flight: Descent (11,000’ AGL) • Effect on Flight: Precautionary landing • Damage: Windshield • Wildlife Species: Western Grebe • Comments from Report: Bird shattered the windshield and caused a large hole injuring the pilot. Aircraft returned to land.
Bird Aircraft Collisions (BAC) • Date: 14 November 2009 • Aircraft: A 319 • Airport: Kansas City Intl. (MO) • Phase of Flight: Climb (4,000’ AGL) • Effect on Flight: Precautionary landing • Damage: Engine • Wildlife Species: Snow goose • Comments from Report: Flight has just departed when pilot reported multiple bird strikes about 4 miles north of the airport. First report was loss of #2 engine, Upon landing he reported both engines had stalled. Damage to #2 engine consisted of a dent in the lower lip and a hole in the underside of the cowling
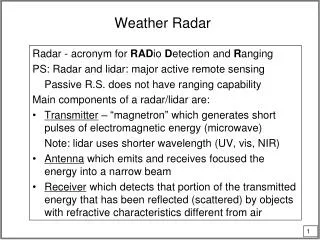
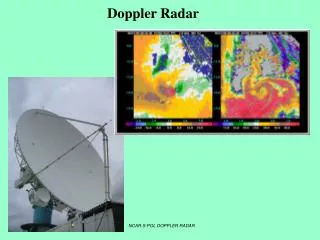
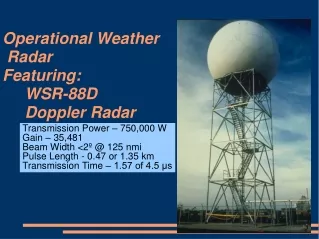
Doppler Weather Radar Sensors • WSR-88D Doppler weather surveillance radar can detect concentrations of migrating birds in the atmosphere out to ranges of 124 nautical miles (Gauthreaux and Belser 1998,1999) and target velocity information can be used to identify the types of biological targets aloft (Gauthreaux et al. 2008). • Terminal Doppler Weather Radar has not been assessed for its ability to detect migrating birds, but its operational characteristics suggest it should be an excellent sensor for that purpose.
Terminal Doppler Weather Radar (TDWR) • Operated by Federal Aviation Administration (FAA) (FAA) • Detects and reports hazardous weather in and around airport terminal approach and departure zones. • Identifies and warns air traffic controllers (ATCs) of low altitude wind shear hazards caused by microbursts and their associated gust fronts. • Measures and reports on precipitation intensities and provides advanced warning of wind shifts. • TDWR reports used by ATCs to warn pilots about hazardous weather patterns.
Terminal Doppler Weather Radar (TDWR) Characteristics • 45 stations located near major airports • Has a limited area of high-resolution coverage of 48 nm (reflectivity and radial velocity) • High-resolution range gates (150 m) • 5 cm (C-band) wavelength • Beam width of 0.55° • Lowest elevation angle ranges from 0.1°- 0.3° • Data available via NOAAPORT as of June 2009
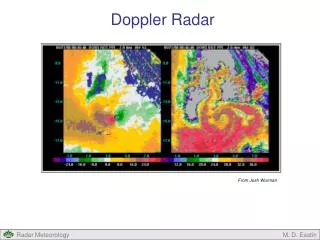
TDWR AND BIRD MOVEMENTS • Base Reflectivity—reflectivity from targets aloft in a 0.5° x 150 m radar pulse volume • Base Velocity—component of mean velocity of targets in a 0.5° x 150 m radar pulse volume that is moving toward or away from the radar. Also referred to as radial velocity. Inbound velocity is negative and outbound velocity is positive.
TDWR AND BIRD MOVEMENTS • Four time slices (14:09; 21:05; 23:03, and 23:57 UTC) of base reflectivity and base velocity from the TDWR at Hobby Field, Houston, TX, on 30 April 2009. • Emphasis on mean radial velocity of radar pulse volumes. • Filtering by wind speed and velocity categories.
72240 LCH Lake Charles Observations at 12Z 30 Apr 2009 ----------------------------------------------------------------------------- PRES HGHT TEMP DWPT RELH MIXR DRCT SKNT THTA THTE THTV hPa m C C % g/kg deg knot K K K ----------------------------------------------------------------------------- 1017.0 10 21.2 19.5 90 14.24 135 7 292.9 333.5 295.4 1003.0 125 21.6 20.9 96 15.78 143 14 294.5 339.8 297.3 1000.0 150 21.4 20.7 96 15.63 145 15 294.6 339.4 297.3 982.2 305 20.3 19.8 97 15.02 165 21 294.9 338.2 297.6 948.2 610 18.1 18.0 99 13.89 165 21 295.7 335.8 298.2 937.0 713 17.4 17.4 100 13.53 170 20 296.0 335.1 298.4 925.0 823 17.0 16.8 99 13.18 175 18 296.7 334.9 299.0 915.1 914 16.4 16.1 98 12.77 180 18 297.0 334.1 299.3 882.8 1219 14.5 14.0 97 11.48 185 22 298.1 331.6 300.1 859.0 1451 13.0 12.3 96 10.57 177 23 298.9 329.9 300.8 851.6 1524 13.0 9.9 82 9.08 175 23 299.6 326.5 301.2 850.0 1540 13.0 9.4 79 8.78 175 23 299.8 325.8 301.3
none -23 kts -30 kts -40 kts
-20 kts none -30 kts -40 kts
LCH Lake Charles Observations at 00Z 01 May 2009 ----------------------------------------------------------------------------- PRES HGHT TEMP DWPT RELH MIXR DRCT SKNT THTA THTE THTV hPa m C C % g/kg deg knot K K K ----------------------------------------------------------------------------- 1017.0 10 25.4 20.4 74 15.07 175 14 297.1 340.9 299.8 1000.0 152 23.8 20.0 79 14.95 175 18 296.9 340.3 299.6 982.7 305 22.4 19.4 84 14.69 175 18 297.0 339.6 299.6 969.0 427 21.2 19.0 87 14.49 179 18 297.0 339.1 299.6 951.0 590 20.4 17.0 81 12.98 184 18 297.8 335.7 300.1 948.8 610 20.2 16.9 81 12.96 185 18 297.8 335.6 300.1 930.0 783 18.8 16.4 86 12.77 193 19 298.1 335.4 300.4 925.0 830 19.0 16.0 83 12.51 195 19 298.7 335.4 301.0 917.0 905 19.2 14.4 74 11.37 195 20 299.7 333.2 301.7 916.0 914 19.1 14.3 74 11.31 195 20 299.7 333.1 301.7 883.9 1219 16.9 11.4 70 9.65 190 20 300.5 329.1 302.2 863.0 1423 15.4 9.4 67 8.65 190 18 301.0 326.8 302.5 850.0 1552 14.2 10.1 76 9.21 190 17 301.0 328.4 302.7
none -20 kts -30 kts -40 kts
none -20 kts -30 kts -40 kts
CONCLUSIONS • The TDWR readily detects migrating birds aloft and concentrations of birds within 48 nm of the airport. • The small pulse volumes of the TDWR (greater resolution) allow better discrimination of biological targets aloft than can be done with WSR-88D. • The radial velocity of targets in relation to winds aloft can be used to separate birds from insects, and fast flying birds from slow flying birds.
CONCLUSIONS • Archived TDWR data on bird density and speed can be used to determine seasonal patterns of bird activity within 48 nautical miles of the airport. • Automatic processing of TDWR data and winds aloft data could produce real time reports on bird densities within 48 nautical miles of the airport for ATC and airport operations.