Download
1 / 42
540 likes | 1.11k Views
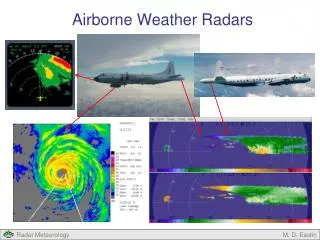
Airborne Doppler Weather Radar Simulation (ADWRS). Research Triangle Park, North Carolina. Les Britt and Joe White, RTI. Turning Knowledge into Practice. What is ADWRS? How does it work? How is it used? Recent Efforts. Topics. Box 2 – ADWRS (Les Britt).

E N D
Airborne Doppler Weather Radar Simulation (ADWRS) Research Triangle Park, North Carolina Les Britt and Joe White, RTI Turning Knowledge into Practice
What is ADWRS? How does it work? How is it used? Recent Efforts Topics Box 2 – ADWRS (Les Britt) Box 3 – Radar Algorithms (Joe White)
ADWRS – Airborne Doppler Weather Radar Simulation A comprehensive simulation of an airborne Doppler weather radar that generates Doppler radar IQ data and associated aircraft data from input weather data files and user defined flight paths.
Version 1.0 (1988): 2D TASS files, Denver SAR maps for clutter, stationary aircraft Version 2.0 (1990): Aircraft moves along glide slope Version 3.0 (1991): 3D TASS files, moving clutter (cars), antenna automatic tilt function, SAR clutter maps (used for wind shear radar certification) Version 4.0 (1999): Arbitrary flight paths, multiple bar scans, generalized clutter model Version 5.0 (2001): Modified to use large TASS files (512x512x128) and new TASS format Version 5.1 (2002): Added new output file with both radar and aircraft data and modified GUI to provide all aircraft data required for post-processing Version 5.2 (2003): New version with batch mode capability for multiple end-to-end data runs, new pre-processor and pre-processor GUI ADWRS History
Generates simulated I & Q radar output files & auxiliary data Simulates: Three antenna classes- (2 measured, 1 theoretical) Antenna side lobe effects Ground clutter & ground clutter filters Transmitter/Receiver phase errors Quantization errors User-selected antenna scanning strategies User-selected aircraft trajectories User-selected radar parameters ADWRS Capabilities
Physics Simulation Calculates Scattering from 100’s of Incremental Scattering Points in each Radar Range Bin (in 3D)
Role in Certification Tool Set A D WRS Radar Post- Processing & Display I & Q Signal Radar Parameters Config. File Aircraft Parameters Radar Param. Simulation Param. A/C Param. Sim. Param. X,Y, Z Wind Vel. ADWRS Pre-processor Other Files Radar Reflectivity Optional A/C G Forces (along a flight path) TPAWS Weather Data Set
Radar IQ and aircraft data file (for Post-Processor) Doppler Spectra file (velocity spectra for selected range bins) Excel spreadsheet file with numerous variables (22) for examination and plotting. Formatted radar IQ output for selected range bins ADWRS Outputs
Example of ADWRS Post-processor Display(TASS Wilmington data @ 7200ft)
Example of ADWRS Post-processor Display(TASS Wilmington data @ 7200ft) Ground Clutter
Generalized TASS/ADWRS pre-processor and GUI Modifications to ADWRS and ADWRS GUI Modifications to post-processing to generate alert icons and store alert log file and display bitmaps (for both flight and simulated data) Modifications and demo of unattended end-to-end (batch) simulation runs Specialized simulation studies Effects of TASS data sub-grid on outputs Radar parameter variations Recent Efforts
Creating Prerequisite FilesFor Batch Processing USER INPUT • Weather Data Files: • X,Y, Z Wind Velocities • Radar Reflectivity PRE-PROCESSOR GUI A D W R S TASS DATASET • Configuration File: • Radar Parameters • Aircraft Parameters • Simulation Parameters ADWRS GUI USER INPUT • I/O File: • Input & Output Filenames • Batch File: • Multiple commands USER INPUT TEXT EDITOR
TASS/ADWRS Pre-processor • Formats 4 TASS weather data files for ADWRS • U,V,W components of velocity & radar reflectivity • Permits selection of a sub-set of the TASS data • Re-size data • Change resolution • Select any portion of data
Provision for renaming files to use in batch mode Updated and revised embedded User’s Guide (pdf file) ADWRS GUI Modifications
ADWRS GUI • Allows entry of configuration parameters without risk of formatting errors. • Provides default values when no specific value is entered.
Plot of Estimated rms g-loadingTASS 191-06 data @ 32000 ft - w component
Plot of Estimated rms g-loadingTASS 191-06 data @ 32000 ft - w component
Plot of Estimated rms g-loadingTASS 191-06 data @ 32000 ft - w component
Plot of Estimated rms g-loadingTASS 191-06 data @ 32000 ft - v component
Plot of Estimated rms g-loadingTASS 191-06 data @ 32000 ft - v component
ADWRS Radar Plot: g-loadingTASS 191-06 data @ 32000 ft - baseline algo
PROCEDURE for Batch Processing • Generate Prerequisite Files: • Weather data files • Parameter files • I/O Filenames • Batch file Initiate Radar GLUI View Stored Plots and Alert Logs Initiate Batch File Runs ADWRS and post-processor
Certification Tool Set – Box 3Radar Algorithm • Moment Calculation Algorithm coupled to hazard tables for generation of predicted g-load map from radar data • Inputs: • I/Q radar data (recorded or simulated) • Aircraft state • Radar state • Processing: • NESPA – NCAR Efficient Spectral Processing Algorithm • Baseline – “Traditional” algorithm by RTI • Output: • Graphical Display to Display Program through Shared-memory interface
Box 3 – Radar AlgorithmHistory • Initial version was a port of the real-time code. It was developed to allow checkout of EVS algorithm on conventional computers (no DSP boards) • Developed versions for baseline and NESPA turbulence processing. • Created additional versions for processing of ADWRS files and integration into Certification Tool Set (NESPA version created under current task)
Box 3 – Radar AlgorithmAvailable Turbulence Versions • PostProcB – Baseline version for use with radar data • PostProcNESPA – NESPA implementation for use with radar data • ADWRSDispB – Processes ADWRS output with Baseline Algorithm • ADWRSDispN – Processes ADWRS output with NESPA
Baseline Time domain editor FFT with window Compute power spectra Average spectra along range Remove a/c velocity Estimate signal and noise power for CFAR Calculate received power and dBZ Calculate moments if CFAR conditions satisfied Estimate scale length Calculate bin-to-bin velocity variance Compute G-load from spectral width and bin-to-bin variance NESPA Time domain editor FFT with window Compute power spectra Remove a/c velocity Average spectra across azimuth Median filter on range spectra matrix Apply NCAR’s NESPA code Box 3 – Radar AlgorithmProcessing
Box 3 – Radar AlgorithmProcessing Features • Display of reflectivity, moments and g-load • Ability to enable/disable processing steps not available in real-time version • Noodle for comparison of in-situ measurements with predicted g-load
Box 3 – Radar AlgorithmRecent Enhancements • Hazard Alerting • Batch Processing Capability
Box 3 – Radar AlgorithmHazard Alerting Algorithm • Objective: • Develop “near-term” alerting algorithm that: • Identifies regions of turbulence above 0.2g rms • Operates in conjunction with engineering displays • Implement in: • Real-time flight system on NASA 757 • Post Processing software in CTS
Box 3 – Radar AlgorithmPresent Alerting Algorithm • Identify >0.2g regions in G-load map • Discard regions in first 1.5km • Discard regions with area < 1km² • Combine regions whose peaks are within 3km • Classify regions • Warning: Peak value of 0.3g or 0.2g with range<9 km. • Caution: Peak value between 0.2g and 0.3g and range>9km.
Box 3 – Radar AlgorithmOutput Hazard Log Hazard Log for data from file: e:\adwrsout\Run2a.dat. NESPA Processing Time: 0:00:09. Hazard regions identified: 1 of 1: bin: 32, Range: 5.1 km, AzIndex: 25, Azimuth: 7.5 deg. Area: 2.37e+007m**2, AvgLoad: 0.269g, PeakLoad: 0.325g Time: 0:00:20. Hazard regions identified: none
Box 3 – Radar AlgorithmAlerting Algorithm Status • Within limitations of radar processing algorithm, the present alerting algorithm flags the occurrence of turbulence regions. • Present implementation is limited to engineering display where map of predicted g-load is available. • Reported alert is based on estimated center of observed region when time-to-encounter requires that near edge of turbulent region be flagged. • Predicted g-load map provides information on extent and location of region(s) • Final alert function will need to combine expected flight path information with g-load map to predict time-to-encounter with near edge of turbulent region
Box 3 – Radar AlgorithmBatch Processing Capabilities • Accepts Command Line Arguments • Input File Name (required) • Screen Capture File Name “Prefix” (optional) • In-situ File Name (optional) • Captures Screen after each 3-bar set of data • Only if Screen Capture File Name is specified • Auto reset to beginning of file is disabled • Output log of hazard alerts