Download
1 / 71
730 likes | 1.01k Views
2 The Oceanic Environment. Notes for Marine Biology: Function, Biodiversity, Ecology By Jeffrey S. Levinton. ©Jeffrey S. Levinton 2001. The Ocean. Geography and Bottom Features. ©Jeffrey S. Levinton 2001. ©Jeffrey S. Levinton 2001. The Ocean and Marginal Seas.

E N D
2 The Oceanic Environment Notes for Marine Biology: Function, Biodiversity, Ecology By Jeffrey S. Levinton ©Jeffrey S. Levinton 2001
The Ocean Geography and Bottom Features ©Jeffrey S. Levinton 2001
The Ocean and Marginal Seas • The worlds oceans: oceans and marginal seas • Oceans cover 71% of earth’s surface • Southern hemisphere 80%, Northern hemisphere 61% • 84% deeper than 2000m • Greatest depth ~ 11,000 m in Marianas Trench
Marginal Seas • Examples: Gulf of Mexico, Mediterranean Sea • Affected strongly by • regional climate, • precipitation-evaporation balance, • river input of fresh water and dissolved solids, • limited exchange with the open ocean (e.g., sill partially cutting Mediterranean from Atlantic)
Marginal Seas 2 • Often have recent history of major change • Mediterranean: completely dry a few million years ago • Baltic Sea: less than 11,000 years old
Marginal Seas 3 • Marginal Seas (Gulf of Mexico, Baltic Sea): • influenced more by drainage and local climate: • 1. River input (Baltic Sea) • 2. Precipitation - evaporation balance (Mediterranean) • 3. Restricted circulation (Black Sea, Mediterranean) • 4. Geological history (Baltic)
Ocean as a Receptacle • Particulate mineral matter • Dissolved salts • Particulate organic matter (POM) • Dissolved organic matter (DOM) • Atmospheric precipitation • Volcanic sources • Water
Topographic Features • Continental shelf (1° slope) • Continental slope (2.9° slope) • Continental Rise • Abyssal Plain • Submarine Canyons • Oceanic Ridge Systems
Topographic Features 2 Shelf Coastal plain Slope Volcanic island Depth (km) Depth (miles) Marginal sea Mid-ocean ridge Continental rise Seamount Abyssal plain Abyssal plain Trench
Eurasian Eurasian American Arabian Caribbean Philippine Pacific Cocos Nazca African American Antarctic Earth’s surface is divided into plates: borders are ridge systems, faults
The Oceanic Crust: Crust is formed at ridges, moved laterally, and destroyed by subduction, which forms trenches Continental crust Inactive fault Continent Trench Fault Oceanic crust Ridge Continental Crust Intermediate, deep- focus earthquakes Mantle
The Ocean Seawater Properties ©Jeffrey S. Levinton 2001
Water molecule • Asymmetry of charge distribution on water molecule - increases ability to form bonds with ions - makes water excellent solvent
Water properties • High heat capacity (0.9) • High heat of evaporation (590 cal/g) • High dissolving power • High transparency (absorbs infrared, ultraviolet)
Vertical Temperature Gradient: Shallow Temperate Ocean • In shallow shelf regions with strong seasonal temperature change - get seasonal thermocline. Example: coastal NE United States - thermocline found in summer continental shelf, with surface warmer wind-mixed layer, deeper cooler water • Winter: vertical temperature distribution much more uniform and cold, from surface to bottom. No strong thermocline
Salinity • Definition: g of dissolved salts per 100g of seawater; units are o/oo or ppt • Controlled by: + evaporation, sea-ice formation - precipitation, river runoff Salinity in open ocean is 32-38 o/oo
Important elements in seawater • Chlorine (19,000 mg/l) • Sodium (10,500 • Magnesium (1,300) • Sulfur (900) • Calcium (400) • Potassium (380) • Bromine (65) • Carbon (28 - variable)
Principle of Constant Element Ratios • Ratios between many major elements are constant all over the ocean, even though salinity varies
Principle of Constant Element Ratios 2 • Why? Because residence time of elements is much greater than time to mix them evenly throughout ocean by water currents (ca. 1000 y)
Principle of Constant Element Ratios 3 • Residence time of Na, Cl, Sr is on the order of millions of years
Principle of Constant Element Ratios 4 • Principle does not apply to elements that cycle rapidly, especially under influence of biological processes (e.g., sulfur, phosphorous)
Measurement of Salinity • Chlorinity: g of chlorine per 1000 ml of seawater • Salinity = 1.81 x chlorinity • Measured by chemical titration
Measurement of Salinity 2 • Conductivity - increases with increasing salinity, has to be corrected for temperature
Measurement of Salinity 3 • Optical refraction - more salt, more refraction of light, uses refractometer
Temperature • Oceanic range (1.9 - 40 °C) less than terrestrial range (-68.5-58 °C) • Deep ocean is cold (2 - 4) degrees
Seawater density (mass/volume) • Influenced by salt, no maximum density at 4 °C (unlike freshwater) • Density measure of seawater at temperature t t= (density - 1) x 1000 t increases with increasing salinity t increases with decreasing temperature Special significance: vertical density gradients
Latitudinal salinity gradient Excess of evaporation over ppt in mid-latitudes Excess of ppt over evaporation at equator
The Ocean Circulation in the Ocean ©Jeffrey S. Levinton 2001
Coriolis Effect - Movement of fluids, in relation to earth beneath, results in deflections
Coriolis Effect and Deflection • Surface winds move over water • Coriolis effect causes movement of water at an angle to the wind (to right in northern hemisphere) • Water movement drags water beneath, and to right of water above • Result: Shifting of water movement - Ekman Spiral (actually friction binds water together and all water moves at a right angle to wind (right of wind in n. hemisphere)
Coriolis Effect and Deflection 2 • Surface winds move over water • Coriolis effect causes movement of water at an angle to the wind (to right in northern hemisphere) • Water movement drags water beneath, and to right of water above • Result: Shifting of water movement - Ekman Spiral (actually friction binds water together and all water moves at a right angle to wind (right of wind in n. hemisphere)
Coriolis Effect and Deflection 3 • Surface winds move over water • Coriolis effect causes movement of water at an angle to the wind (to right in northern hemisphere) • Water movement drags water beneath, and to right of water above • Result: Shifting of water movement - Ekman Spiral (actually friction binds water together and all water moves at a right angle to wind (right of wind in n. hemisphere)
Coriolis Effect and Deflection 4 • Surface winds move over water • Coriolis effect causes movement of water at an angle to the wind (to right in northern hemisphere) • Water movement drags water beneath, and to right of water above • Result: Shifting of water movement - Ekman Spiral (actually friction binds water together and all water moves at a right angle to wind (right of wind in n. hemisphere)
Coastal Winds + Coriolis Effect = Upwelling Southern hemisphere: water moves to the left of wind
Oceanic Circulation • Wind-driven surface circulation • Density-driven thermohaline circulation
Wind-driven Circulation • Driven by heating of air near equator, which rises, moves to higher latitude, falls, creating circulation cells that are affected by Earth’s rotation. Air moves surface water • Prevailing westerlies (40°N & S latitude) • Trade winds (toward the west)
Wind-driven Circulation 2 • Combination of wind systems and shapes of ocean basins create cyclonic flow known as gyres • Rotation of earth tends to concentrate boundary currents on west sides of ocean - creates concentrated currents such as Gulf Stream
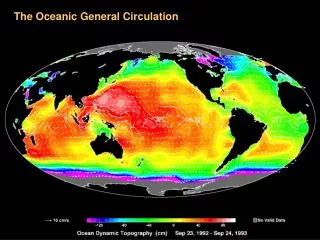
Wind-driven Circulation 3 Wind systems Surface currents Subpolar gyre Westerlies Subtropical gyre NE Tradewinds Doldrums Subtropical gyre SE Tradewinds Westerlies West wind drift
Thermohaline Circulation • Water in the ocean can be divided into water masses, identified by distinct temperature, salinity, and other physico-chemical characteristics
Thermohaline Circulation 2 • Thermohaline circulation is movement of ocean water controlled mainly by density characteristics • Controlled by (1) Location of formation of water, (2) density, (3) Coriolis effect to a degree
Thermohaline Circulation 3 • Water masses formed in high latitude surface waters - water is cold, often high salinity because of ice formation • Waters sink, move at depth towards lower latitude • Water masses each have a characteristic depth, because of their density, which is largely a function of their high latitude surface origin
Thermohaline Circulation 4 AABW=Antarctic Bottom Water; AAIW = Antarctic Intermediate Water; NADW = North Atlantic Deep Water
Circulation Recap • Coriolis effect - rotation of Earth, prop. to sine of latitude, Right deflection in N. hemisphere, Left deflection in S. hemisphere - upwelling, deflection of currents
Circulation Recap 2 • Surface circulation - driven by planetary winds, which are controlled by heating, convection, Coriolis effect - gyres, eastern boundary currents