Download
1 / 6
60 likes | 180 Views
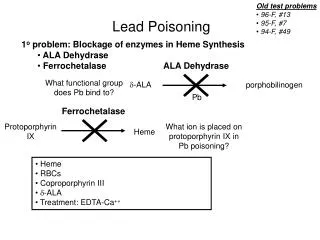
Tracking Childhood Lead Poisoning in Providence Among Refugees. Sunil Hebbar, Alpert Medical School Special thanks: RI AHEC Program RI Department of Health Refugee Health Coordinator – MariaLuisa Vallejo. Background.

E N D
Tracking Childhood Lead Poisoning in Providence Among Refugees Sunil Hebbar, Alpert Medical School Special thanks: RI AHEC Program RI Department of Health Refugee Health Coordinator – MariaLuisa Vallejo
Background • In RI, 8% of children entering kindergarten in 2006 had elevated blood lead levels (BLLs) – mainly attributable to housing exposure • Refugee children are at higher risk of lead poisoning, due to nutritional and other factors • In a study of Somali-Bantu refugees in MA, 11% were lead poisoned only on first screening, and 14% were lead poisoned on both first and second screening
Project Proposal • Determine the possible effects of housing on the lead levels of refugees settled in Providence In order to: • Investigate the scope of lead poisoning • Evaluate housing and resettlement policies for refugees • Develop educational interventions
Preliminary Findings of Childhood Lead Poisoning Refugees Prevalence 2004 – 39.4% 2005 – 40.3% 2006 – 24.7% 2007 – 24.6% 2008 – 14.1% Incidence 2008 – 9.5% Non-refugees Prevalence 2004 – 8.9% 2005 – 7.0% 2006 – 5.8% 2007 – 4.6% 2008 – 3.8% Incidence 2008 – 2.9%
Future Goals • Complete statistical overview of lead poisoning in refugee and non-refugee children in Providence • Illustrate the changes in lead levels of refugee children following arrival and resettlement in Rhode Island • Assess the effects of housing quality and standards on refugee lead levels • Tailor educational policies to improve outcomes