Download
1 / 25
250 likes | 370 Views
Childhood Lead Poisoning in New York State. Symposium To Examine Lead Poisoning in NYS March 13, 2006 Rachel de Long, M.D., M.P.H. Director, Bureau of Child and Adolescent Health NYS Department of Health. Childhood Lead Poisoning: A preventable public health problem.

E N D
Childhood Lead Poisoning in New York State Symposium To Examine Lead Poisoning in NYS March 13, 2006 Rachel de Long, M.D., M.P.H. Director, Bureau of Child and Adolescent Health NYS Department of Health
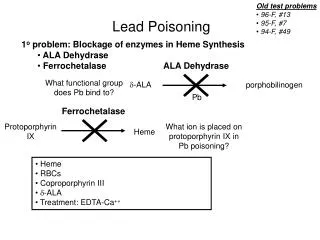
Childhood Lead Poisoning: A preventable public health problem • Lead poisoning defined as a blood lead level > 10 mcg/dL • Recent research suggests may be no ‘safe’ level of lead • Level of intervention varies by blood lead level, consistent with evidence of effectiveness • Tremendous progress in lowering prevalence and severity of childhood lead poisoning over past several decades
Childhood Lead Poisoning: A preventable public health problem • Elevated blood lead levels (EBLLs) associated with range of negative outcomes • Cognitive deficits • Behavioral problems • Anemia • Diminished bone growth • Dental caries • Hypertension • Osteoporosis • Poor pregnancy outcomes
Factors associated with lead poisoning • Young Children are at highest risk for lead poisoning • BLLs typically rise between 6-12 months and peak between 18-36 months of age • Consistent with normal child development: • Increased mobility • Active exploration of environment • Hand-to-mouth behavior • Efficient GI absorption of lead vs. adults
Factors associated with lead poisoning • Other Individual Factors • Developmental factors • Hand-to-mouth behaviors • Pica • Nutritional status • Iron and calcium deficiency • Hobbies/occupation • Use of contaminated consumer products • Practice of protective behaviors
Factors associated with lead poisoning • Community Level Factors • Age and condition of housing • Deteriorating paint • Disturbance of intact paint (renovation/remodeling) • Poverty/socioeconomic status • Racial minority populations • Immigrant/refugee populations • Community-specific exposures (e.g. industry)
Sources of lead exposure • Deteriorating paint (chips or dust) • Soil (deposits from leaded gasoline, paint, industry) • Water (lead plumbing) • Traditional remedies, cosmetics, consumer products • Occupational and hobby exposures • Industry
Factors associated with lead poisoning: NYS Data • New York State has the highest percent of pre-1950 housing in nation • 55% of housing in New York City † • 40% of housing in Upstate New York † • Children living in poverty • 26% of children in NYC live below the federal poverty level (FPL) † • 14% of Upstate children live below FPL † • 36% of Upstate children are eligible for Medicaid in 2004. • WIC Eligibility • 40% of all NYS children were enrolled in WIC in 2005. † 2000 Census
Factors associated with lead poisoning: NYS Data • Non-white minority children • 77% of children in NYC were identified as non-white by their parents or guardians. † • 23% of Upstate children were identified as non-white by their parents or guardians. † • Foreign-born children represent 23% of all NYS children. • Over 10,000 refugees entered NYS in 1999 † 2000 Census
NYS: Lead Screening of Children • NYS Lead Screening Requirements • Universal blood lead testing at or around age 1 year and 2 years • Annual risk assessment, with blood lead testing as indicated, up to age six years • Assessment of lead screening status on enrollment in child care/preschool, with referral and education as needed • Screening is essential for: • Identification and follow-up of individual children with lead poisoning • State and local level surveillance and program planning
NYS Data: Lead Screening Rates • Initial Test Data • 67.6% children outside of NYC received at least one blood lead test by 24 months of age (2001 birth cohort) • Increase of 5% since 1996 • 66% of children in NYC received at least one lead test by age one year • 84% of children in NYC had at least one lead test before their third birthday (2000 birth cohort) • 74% of children enrolled in Medicaid Managed Care tested at least once by age 24 months • Nationally, only 43% of Medicaid-eligible children ever receive a blood lead screening test
NYS Data: Lead Screening Rates • Second Test Data • Of those upstate children with non-elevated initial screening test, 32% received a second lead test (1996-2000 data) • 30% NYC children received blood lead test at both 12 and 24 months of age (2000 birth cohort)
NYS Data: Prevalence of Lead Poisoning • Prevalence- total number of children with lead poisoning during a specific time • Prevalent cases, 10-19 mcg/dL in Upstate NY • 4,140 (2.3 cases/100 tests) • This is a 28% decrease since 2000 • Prevalent cases, 20+ mcg/dL in Upstate NY • 413 (0.2 cases/100 tests) • This is a 35% decrease since 2000
NYS Data: Incidence of lead poisoning • Incidence: newly identified children with elevated blood lead levels * NYC rates are based on tests of children 0-18 years of age
Lead Poisoning is not evenly distributed across the state • 36 high-incidence upstate zip codes account for over 40% of the new cases of EBLL outside NYC (2000-2001 data) • Zip codes with >5% incidence rate EBLLs • 2% of all upstate zip codes • Urban neighborhoods characterized by higher rates of poverty and pre-1950 housing • 18 high-incidence neighborhoods account for more than 73% of new cases of EIBLL (>15mcg/dL) in NYC • Brooklyn has 10 of 11 neighborhoods with EIBLL rates higher than the citywide incidence rate.
Success in targeting screening promotion efforts • High-incidence communities have higher lead screening rates • Previous study showed that 80% of children in high-incidence upstate zip codes screened vs. 61% of all children screened over same time period (1994-97 birth cohorts) • Seven of NYC highest-incidence neighborhoods also have higher than NYC- average screening rate Haley VB., & Talbot TO. (2004) Geographic analysis of blood lead levels in New York State children born 1994-1997. Environmental Health Perspectives, 112(15): 1577-1582.
Elimination of Childhood Lead Poisoning by 2010 • Healthy People Goal: Elimination of Childhood Lead Poisoning by 2010 • NYS Plan for the Elimination of Childhood Lead Poisoning by 2010 • Released June 2004 • Complements NYC Elimination Plan • Plan provides a framework for lead elimination work of NYSDOH and partners • Living document informed by ongoing input from multiple stakeholders and success of elimination activities
Public Health Approach to Elimination of Childhood Lead Poisoning • Surveillance • Screening • Follow-up/management of EBLLs: education, nursing, environmental • Primary Prevention • Targeting High-Risk Populations • Strategic Partnerships