Download

1 / 58
580 likes | 586 Views
South Carolina Surface Water Monitoring: Different Designs for Different Objectives. Presented by David Chestnut. Reporting Requirements. §305(b) Report Comprehensive statewide summary report on water quality to Congress every two years §303(d) List Listing of impaired waters

E N D
South Carolina Surface Water Monitoring: Different Designs for Different Objectives Presented by David Chestnut
Reporting Requirements • §305(b) Report • Comprehensive statewide summary report on water quality to Congress every two years • §303(d) List • Listing of impaired waters • Submitted to EPA every two years
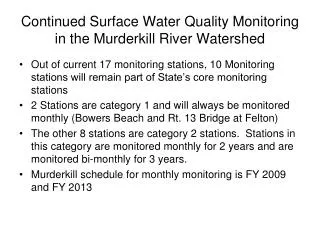
Other SCDHEC Reporting Activities • Watershed Water Quality Assessments (WWQA) • Healthy People Living In Healthy Communities
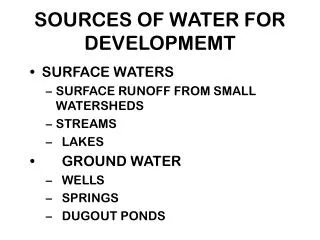
Other Data Needs • Capability for targeted monitoring for specific needs: • Special studies • Tracking of implementation of control strategies • Respond to emerging issues
Purpose of the Ambient Water Quality Monitoring Program • The collection and analysis of data needed to make water quality management decisions: • Determine water quality status & identify waters not supporting classified uses (§305(b), §303(d), WWQA) • Determine long-term trends in concentrations of various constituents at individual sites (WWQA) • Collect data for Wasteload Allocation Models • Support specific NPDES permit limits • Evaluate effectiveness of SCDHEC programs
Basic Designs of Ambient Surface Water Monitoring are: • Big Picture: • Make statements about representative WQ at varying scales (§305(b), WWQA) • Site Specific • Examine long-term trends in concentration of specific WQ parameters • Identify waterbodies not meeting classified uses (§303(d)) • Track specific targeted activities
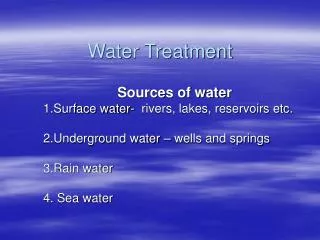
Main Ambient Monitoring Activities • Physical & Chemical Monitoring • Water Column • Sediment • Biological Community Monitoring • Macroinvertebrate • Fish Tissue Monitoring
Components of the Ambient Monitoring Network Design • Fixed Monitoring Network • Long-term trends • Consistent statewide coverage • Cyclical Basin Monitoring • More spatially dense coverage • Watershed focus • Probability-Based Monitoring • Statistical survey of statewide resources • Sample new locations
Types of Fixed Statewide Surface Water Chemistry Monitoring Sites • Integrator & Special Purpose Sites • Sampled monthly year-round • Target outflow of 11-digit WSU or specific data needs • Special Summer-Only Sites • Sampled monthly May-October • Target specific data needs • Basin Sites • More-or-less fixed, on a 5 year cycle • Sampled monthly for 1 year when active
Probability-Based Component • Probability Sites • Sampled monthly for 1 year • Make comprehensive statements about statewide WQ conditions (§305(b) use support) • Unbiased random sample (survey) • Known confidence of estimates • Sample previously unsampled locations • Identify new §303(d) candidates
Assistance in Development of Probability- Based Monitoring • Ron Raschke – Region IV EPA (retired) • Kent Thornton – FTN Associates • EPA ORD National Health & Environmental Effects Research Laboratories • Tony Olsen – EPA ORD NHEERL Corvallis, OR • Kevin Summers – EPA ORD NHEERL Gulf Breeze, FL • Bob Van Dolah – SCDNR MRRI
Resource Types Assessed Using Probability-Based Approach • Streams • Lakes • Estuaries
Primary Uses to be Assessed with Probability Data • Statewide • Aquatic Life Use Support • Recreational Use Support
In order to do that, sufficient data must be collected at each Probability Site to apply SCDHEC’s Assessment Methodology • This is a different approach than that employed by most other states with Probability-Based designs
Core Parameters - All Physical & Chemical Sites *Freshwater sites only
} Saltwater sites only Core Parameters - Waterbody-Type Specific Monthly Salinity Conductivity Chlorophyll a (May-Oct. all lakes and select estuarine) Transparency (Secchi depth, all lakes)
313 Integrators (statewide) 31 Special Purpose (statewide) 5 Summer Only (statewide) 8 Sediment Only (statewide) 83-104 Basin Sites (depending on target basins) 90 Probability Sites (statewide) Ambient Surface Water Chemistry Monitoring Numbers
You Need to Have a Little of Everything • Probability based for big picture statements • Fixed sites to examine long-term trends in individual parameters • Capability for targeted monitoring for specific needs: • Emerging issues/special studies • Tracking of implementation of control strategies
Expected Benefitsof Whole Package • Consistent & comparable data statewide • Known confidence in §305(b) statements • Sample previously unsampled locations • Identify new §303(d) candidates
§305(b) Probability Sites Initially a comparison of old approach, all data all sites, with probability results §303(d) Integrator Sites Special Purpose Sites Summer Only Sites Basin Sites Probability Sites Other QA’d data Use of Generated Data
Use of Generated Data • Watershed Water Quality Assessments • All available data for basin • Assess use support • Assess long-term trends • Track corrective actions
So what do the results show? Traditional 5 -Year §305(b) Assessment vs. Probability-Based Stream Results
Traditional 5 -Year §305(b) Assessment • Individual fixed sites selected for a variety of reasons, e.g. below point source, urban area, background conditions, citizen concerns, other special interests • Individual sites (points) are sampled • Segments or polygonal areas are assigned to be represented by the water quality at the sampled point • Based on professional judgment; general landuse, stream size, local knowledge, etc. • Determines size represented by individual point
Targeted Categories for Probability-Based Sites • Streams (30 sites per year) • Sampled monthly • First order streams • Second order streams • Third order & greater streams • Unequal weights
Rivers & Streams • Traditional §305(b) Approach • NHD 29,794 Total Miles • 630 water quality monitoring sites • Representing 15,312 miles assessed • Probability-Based Approach • Estimated 20,954 miles in stream design frame • 58 water quality monitoring sites 2001-02 • 118 water quality monitoring sites 2001-04 • Representing all miles
12% 23% 65% 6% 18% 15% 17% 65% Fully Supporting (Good) 79% Partially Supporting (Fair) Not Supporting (Poor) Rivers & Streams Aquatic Life Use Support (ALUS) Traditional §305(b) 1998-2002 Probability 2001-2002 Probability 2001-2004
22% 59% 19% 22% 15% 47% 49% 36% 31% Fully Supporting (Good) Partially Supporting (Fair) Not Supporting (Poor) Rivers & Streams Recreational Use Support Traditional §305(b) 1998-2002 Probability 2001-2002 Probability 2001-2004
Percent of Rivers & Streams Impaired by Specific Causes * - Misleading because not every site had a macroinvertebrate assessment. The total resource size represented by macroinvertebrate results is 5,667 miles
Difference in Recreational Use & Fecal Coliform Impairment Numbers • In the past the tendency was to establish fixed sites on stream locations with strong public use or interest • Under the traditional §305(b) approach, larger streams represent a lot of the total miles assessed compared to smaller order streams • The smaller order streams not "represented" are just assumed to be "not assessed“
Difference in Recreational Use & Fecal Coliform Impairment Numbers • All the traditional percentages are based on the total stream miles assessed • So the small streams are under-represented in the total miles assessed • Under the probability-based assessment they are now 100% represented, as are all other stream sizes
That’s All Folks! Any Questions? Discussion?
Targeted Categories for Probability-Based Sites • Significant Lakes with Public Access (30 sites per year) • Sampled monthly • Major lakes ( 850 acres) • Minor lakes (40 to 850 acres) • Unequal weights
Lakes & Reservoirs • Traditional §305(b) Approach • NHD 407,505 Total Acres • 107 water quality monitoring sites • Representing 227,275 acres assessed • Probability-Based Approach • Estimated 308,765 acres of lake/reservoir in design frame • 61 water quality monitoring sites 2001-2002 • 91 water quality monitoring sites 2001-2003 • Representing all acres
17% 20% 63% 9% 4% 11% 16% Fully Supporting (Good) 75% 85% Partially Supporting (Fair) Not Supporting (Poor) Lakes & Reservoirs Aquatic Life Use Support (ALUS) Traditional §305(b) 1998-2002 Probability 2001-2002 Probability 2001-2004
1% 1% 99% 100% Fully Supporting (Good) Partially Supporting (Fair) 99% Not Supporting (Poor) Lakes & Reservoirs Recreational Use Support Traditional §305(b) 1998-2002 Probability 2001-2002 Probability 2001-2004
Tidal Creeks Open Water Targeted Categories for Probability-Based Sites • Estuaries (30 sites per year + 30 more with cooperators) • 30 visited monthly • Two distinct strata • Open water (> 100 m wide) • Creeks (< 100 m wide)
Habitat Designation Criteria Less than 100 m wide
Unsampled Shoals Tidal Creeks Open Water 17% 83%
Estuaries • Traditional §305(b) Approach • 401 Total Square Miles • 79 water quality monitoring sites • Representing 221 square miles assessed • Probability-Based Approach • 277 square miles in the estuarine sampling design frame • 60 water quality monitoring sites 2001-02 • 120 water quality monitoring sites 2001-04 • Representing all square miles