Download
1 / 20
200 likes | 208 Views
Organizational Learning Through Data Review. ILT January 12, 2015. Outcomes. Understand the district approach to evaluating effectiveness of curriculum and instructional delivery through data review processes

E N D
Organizational Learning Through Data Review ILT January 12, 2015
Outcomes • Understand the district approach to evaluating effectiveness of curriculum and instructional delivery through data review processes • Appreciate the potential collective impact of small individual improvements in STAAR performance • Recognize the district CBA data analysis process
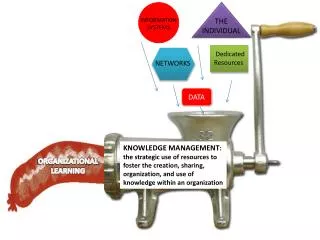
Organizational Learning • The detection and correction of error (Argyris & Schön, 1978) • Organization-wide continuous improvement process that enhances the collective ability to accept, make sense of, and respond to internal and external change • Systematic integration and collective interpretation of new knowledge gained through risk-taking as experimentation resulting in organizational action Predictable Quality Outputs Variable Inputs Argyris, C., & Schön, D. (1978). Organizational learning: A theory of action perspective. Reading, MA: Addison Wesley. Responsive Processes
The district journey Variability in processes limits our ability to effect change
The current state What is the appropriate response to data such as these?
The current state Why is there less variability in performance in 2015 than in previous years?
Tier 1 Priorities Vocabulary of the Standards Workshop Model Three Types of Thinking (Close Reading) Guided Reading Tightening instructional delivery to improve student learning
2 The POWER of Get 5
2 The POWER of
2 The POWER of Level I Level II Level III
Grade 4 Writing 4 pt rubric x 2 scorers = 8 points/essay 8 points/essay x 2 essays = 16 raw score pts for essays PlusOne impact on overall score 1 extra point/essay = 1 pt x 2 scorers x 2 essays = 4 pts extra Essays
Grade 4 Writing 1 pt x 2 scorers x 2 essays = 4 pts Grade 7 Writing 1 pt x 2 scorers x 2 essays x 2 = 8 pts English I and English II 1 pt x 2 scorers x 1 essay x 3 = 6 pts
Calibrating instruction and assessment using district CBAs Suggestions for Reteach/Review Curriculum Improvements Curriculum Coordinators Evaluate alignment between classroom instruction, common assessments and district CBAs PLC District Data Review PLC CBA Analysis Protocol Regroup, Reteach, Redesign District CBA Common assessment CA CA CA Lessons Assessments Unit 1 Unit 2 Unit 3 Unit 4 PLCs have a responsibility to maintain quality control over instructional delivery
CBA central data review process • Identify 3 items with the lowest performance on two tests under the coordinator’s purview • Determine what students should know and be able to do to correctly answer the questions • Use item answer distribution to determine common errors in thinking or problem solving • Ascertain where in the scope and sequence students had an opportunity to learn the necessary content or skills • Celebrate data indicating performance improvement or mastery of standards • Based on OFIs identified, develop materials for review or reteach and make updates to curriculum documents
60% 20% 11% 8% TEKS 4.5B. Predict the changes caused by heating and cooling such as ice becoming liquid water and condensation forming on the outside of a glass of ice water 4.5B (Unit overview, 1st 6 weeks): Students might think that condensation on a glass comes from inside the glass, rather than from the outside air; be sure to clarify that water vapor in the air condenses on the glass. See note for 4.5B in Resources below. 4.5B Resources AIMS Kool Kups; STEMScopes Engage; STEMScopes Explore Part 3, etc.
Data review take-aways • Recognition that we need to be finding solutions, rather than making excuses • Find ways to address gaps both moving forward this year, and by improving curriculum and delivery for next year • Currently in the learning curve to determine the most efficient and effective way to review CBA data and respond in a manner conducive to improving instruction • Meeting with HEB coordinators • Beefing up review process for February CBAs • Implementing expectations for similar reviews at the campus level next year