Download
1 / 59
590 likes | 891 Views
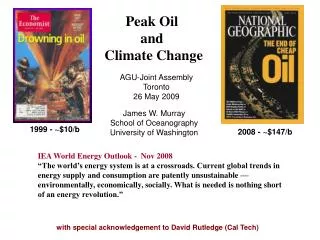
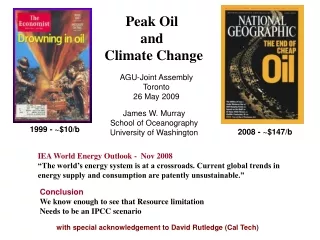
Peak Oil and Climate Change MBARI February 2010 James W. Murray School of Oceanography University of Washington 1999 2004

E N D
Peak Oil and Climate Change MBARI February 2010 James W. Murray School of Oceanography University of Washington 1999 2004 “We are all extraordinary skeptical of the "peak oil" stuff. We know of no reliable information that suggests that we're going to be running significantly short of any fossil fuel in this century…It certainly won't happen with any significant price on carbon.” “We've done a few 300-year scenarios that have some shortages in them, but even that may not be realistic. This is especially so with coal!” “The Chinese say they have enough coal for centuries…” PNNL Climate Modelers with special acknowledgement to David Rutledge (Cal Tech) and Jim Hansen (Seattle)
18.7% / yr The price of oil has increased almost continuously since 1999. If oil gets too high the economy becomes unstuck If oil gets too low new investment is halted
Ali al-Naimi – Sweet spot for oil prices ≈ $75 But the price will be difficult to control. Expect the economy to zig-zag in the future with the lows getting progressively higher
Energy as a buffer on economic growth James Hamilton (UCSD) – Recessions generally correlate with the price of oil. If energy expenditures rise faster than income, then the share of income for other things must decline Oil Expenditures as a % of GDP 5.7% is the key
The Price Elasticity of Demand has become virtually zero. It’s a supply limited market. from Kenneth Deffeyes
Changing Perceptions of Peak Oil During 2009 the most significant story about peak oil was published by The Guardian (UK) on November 9th Whistleblower #1, still with the IEA, said "The IEA in 2005 was predicting oil supplies could rise as high as 120 million barrels a day by 2030 although it was forced to reduce this gradually to 116m and then 105m last year [2008]. The 120m figure always was nonsense but even today's number is much higher than can be justified and the IEA knows this. Many inside the organization believe that maintaining oil supplies at even 90m to 95m barrels a day would be impossible but there are fears that panic could spread on the financial markets if the figures were brought down further.” Such honesty isn’t tolerated by IEA member state USA, which apparently leaned hard on the Agency to bury this hard truth for years. There was a similarly strong warning from a heavy-weight within the oil industry. Christophe de Margerie, CEO of oil super-major Total SA, had previously issued warnings about world oil supply constraints. In 2007, he stated that “production of 100 million barrels a day will be difficult.” He upped the ante during 2008, claiming that “world oil production would peak at or below 95 million barrels per day.” On February 10th, 2009, the CEO’s statement could have been issued by ASPO-USA: “world oil production may plateau below 90 million barrels per day.” Oil optimists like Daniel Yergin and Michael Lynch pushed back against the peak oil story on op-ed pages of several major US newspapers. Reporters wrongfully continued to link peak oil to “running out of oil,” and to confuse reserves with production rate. A fog of sorts still plagues the issue in the media.
Natural Gas Shale Gas is the big news – in the US the Barnett, Haynesville, Fayetteville and Marcellus formations get the big news. But while the initial production rates are very high the first year decline rates are extremely steep. Example below from the Barnett Fm. in Texas Environmental issues (ground water contamination) associated with hydraulic fracturing (fracking) are a major issue. An exemption from the Clean Water Act is required. Arthur Berman At $7.00/Bcf requires 1.5 Bcf. Avg Barnett = 0.95
Todays Conclusions Evidence is strong suggesting that energy resource limitation will be a serious issue. Peak Oil has occurred or will occur soon. Why? existing oil fields are declining at ~5-7% (~5 mbd) New discoveries are not keeping up. Oil and Coal Reserves are much less than assumed by the IPCC. We know enough to see that Resource Limitation needs to be an IPCC Scenario “geological limitation of oil, gas and coal will result in significantly less production of CO2 than assumed in the IPCC scenarios”
Outline • The 4th UN IPCC Assessment Report SRES Scenarios • Oil Reserves • Hubbert’s peak • The history of US oil production • How much oil and gas will the world produce? • The Coal Question • Discussion • Future carbon-dioxide levels and temperatures • Summary
The UN Panel on Climate Change (IPCC) • The UN Intergovernmental Panel on Climate Change publishes assessment reports that reflect the scientific consensus on climate change • The 4th report was released in 2007 • Over one thousand authors • Over one thousand reviewers • Nobel Prize • Updated measurements show that the global temperature is rising 0.013C per year for the last 50 years • Report discusses climate simulations for fossil-fuel carbon-emission scenarios • There are 40 scenarios, each considered to be equally valid, with story lines and different government policies, population projections, and economic models AR5 will only have 3 scenarios
Oil Production in the IPCC Scenarios Gb = billions of barrels 1 barrel = 42 gallons = 159 liters In 13 scenarios, oil production is still rising in 2100 In none of the scenarios did oil production decrease because of resource limitation Oil Production is never going to be more than today (28 Gb) 28 11
CO2 emission Scenarios From Oil + Gas + Coal These scenarios drive almost all climate change research
What is Peak Oil? It’s not about Reserves! It’s all about the Production Rate! We are not close to running out or oil
OPEC Oil “Proven” Reserves! Not proven by anybody! • Accurate reserve estimates for OPEC countries are closely guarded state secrets • Values for 1983 are probably accurate (for 1983) • 430Gb rise in reserves, no adjustment for 193Gb produced since 1980 • These questionable reserves are 45% of world oil reserves used by IPCC! • A recent leak of Kuwait Petroleum Company documents showed the actual reserves are only 48Gb (official reserves are 102Gb) • 1980 Kuwait reserves adjusted for production since then are 55Gb From BP Statistical Review Gb = billions of barrels
M. King Hubbert • Geophysicist at the Shell lab in Houston • In 1956, he presented a paper with predictions for the peak year of US oil production
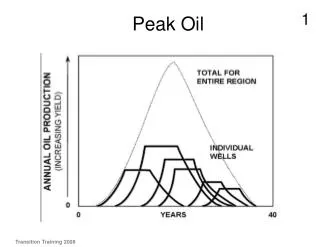
A model logistic distribution Oil Wells and Fields Peak --- Regions Peak --- The World will peak Everyone agrees that world oil will peak – controversy on the date
Mexico Was the #2 supplier of oil to the US Now is #4 Cantarell from >2,000 in 2005 to 860,000 in Jan 2009 to 588,000 in July 2009 Both Mexico and the US are in trouble. Mexico: Sale of oil = 40% of federal budget US: Net exports go to 0 in ~2014
Typo: Million! US Oil Consumption today is about 20 million barrels of oil/day ANWAR will not save us!
Hubbert’s Peak • From Hubbert’s 1956 paper • Hubbert drew bell-shaped curves by hand, and added up barrels by counting squares • For the larger estimate, he predicted a peak in 1970 • Hubbert has been much criticized there is no consideration of supply and demand curves, prices, or policy, and new technologies
Case Study: Apply the Principals of Hubbert’s Model to the US to see how this works
US Crude-Oil Production Production is bell-shaped, like the curves Hubbert drew Average price after the peak is 2.6 times higher than before Production Price 23
The Logistic Curve or Rate Plot P/Q = mQ + a Q for which P/Q = 0 is 198 gigabarrels of oil. Also called Qt (maximum cumulative production) Half of this is 99 which occurred in 1973 Lower 48 A model for exponential growth in a finite system
225Gb ultimate 90% exhausted in 2011 Another Approach: Cumulative Oil Production Includes 48+Alaska • EIA data from 1859 • Fit for cumulative normal gives the ultimate production and the time for 90% exhaustion 31Gb remaining USGS/MMS assessment 189Gb
Historical Projections for US Oil The power of Hubbert Linearization is that it uses past behavior of a system to indicate possible future performance rather than relying on the overoptimistic opinions of resource “experts” USGS McKelvey Hubbert 26
Can we apply this approach to estimate ultimate global oil production?
World Oil Production Peaked in May 2005 non-OPEC Peaked in 2004 Saudi Arabia peaked in 2005, Russia appears to have peaked IEA still predicts an increase (May 19, 2009) MBD Year
Rate Plot: Maximum Cumulative Production (Qt) = 2165 Gigabarrels ½ Qt = 1083 Gb
Who are the experts that IPCC turn to? Energy Information Agency (EIA) - DOE International Energy Agency (IEA) – Paris US Geological Survey (USGS) - Washington Their economic models for future emissions aredriven by demand (not supply). EIA, IEA and IPCC assume that supply will meet demand USGS assumes much oil yet to be found The EIA forecasts in 2008 projects a 30% increase in oil production between now and 2030 (from 85 to 97 mb/d) (D = +12 mbd). The hard truth is that increasing energy supply at all will be difficult. To have growth we need to balance decline of exisiting fields with discovery of new oil
Existing Oil Fields are in Decline Existing oil fields are declining at - 6.7% per year (IEA 2008) For 2005 to 2030 the world needs 45 mbd of new production – just to maintain flat production The projected growth requires discovery of 45 + 12 = 57 mbd of new oil! 57 ÷ 9 = ~6+ new Saudi Arabias
Urban Legend – we can drill more to get more oil Oil discoveries have been declining since 1964 The red box shows the average amount estimated to be discovered by the USGS each year between 1995 and 2025. The world’s oil provinces have been well explored. Future discoveries will be limited to smaller structures and deeper formations
Canadian Oil/Tar Sands bitumen API Gravity = 8-10 (cold molasses) viscosity = 10,000 high sulfur = 5% Hugh resource = 1.7 trillion barrels but at most 0.3 tb available for extraction surface mining (~20%) in-situ (SAGD) (~80%) 1.2 mbd in 2008; projected 2.4 mbd in 2020 4 barrels of water for each barrel of oil 2 tons tar sands = 1 barrel Oil Junkies Last Fix – Big energy demand Law of Receding Horizons EROI = ~6:1 gold (natural gas) to lead (oil) Neither scaleable nor timely
What about coal? There are supposed to be hundreds of years of supply of coal! Big 3 Reserves: US (27%) Russia (17%) China (13%) then India, Australia, South Africa Remarkably the data-quality is very poor globally but especially for China (last update 1992) and SE Asia and FSU World Energy Council = WEC
The reserves to production ratio (R/P) “It has been estimated that there are over 984 billion tonnes of proven coal reserves worldwide…This means that there is enough coal to last us over 190 years.” The Coal resource, World Coal Institute, 2005 Future Supplies are often discussed in terms of the reserves-to-production (R/P) ratio. Sounds sensible but supply forecasts of nonrenewable resources based on R/P ratios are always wrong! Three main reasons.. 1. Rates of consumption of energy are never constant - they increase 2. It is physically impossible to maintain a constant rate of extraction until the resource is exhausted 3. Reserves are not static, but can increase as a result of new discoveries and new technologies or decrease due to better data. The R/P approach is useless – but now five independent groups have attempted an to determine when peak coal will occur. These include the Energy Watch Group (EWG), Institute for Energy, Aleklett (Uppsala University), Rutledge (Cal Tech)
We have a big problem with coal. The reserves may not be as large as We’ve been led to believe. "Present estimates of coal reserves are based upon methods that have not been reviewed or revised since their inception in 1974, and much of the input data were compiled in the early 1970s. Recent programs to assess reserves in limited areas using updated methods indicate that only a small fraction of previously estimated reserves are actually minable reserves." from the National Academy of Sciences Report on Coal, June, 2007
Another Problem is Energy Content IPCC reports energy units (ZJ) Types of coal (four types – different energy content) Anthracite (30 MJ/kg) Bituminous (19 – 29 MJ/kg) Sub-bituminous (8-25 MJ/kg) Lignite (5-14 MJ/kg) The high energy coal is running out US passed peak anthracite in 1950 peak bituminous in 1990 Total energy content of US coal peaked in 1998 Total energy content of world coal should peak in 2025
Energy Watch Group(2007) Coal: Resources and Future production *Key finding is that data quality is very bad.* Reserves Key message is how fast they have been revised downward – 55% in last 25 yrs Germany (23 Bt to 0.18 Bt) and UK down by 90% Counter to conventional wisdom China (largest producer) 55 yrs at current rates – but reserves not updated since 1992! So now 40 yrs but at 1992 production rates China is now a net coal importer. EWG states that China will peak in next 5 - 15 yrs USA (“the Saudi Arabia of coal”) 200 yrs of proven reserves! But many are of low quality and high sulfur Volume will increase for another 10 to 15 years but net energy will decrease – due to transport and CCS Global Picture Six countries hold 90% of reserves Rarely is coal exported The world coal energy peak will occur ~2025 Compare with IEA WEO scenarios Reference scenario is unrealistic Alternative scenario is feasible
Can we apply Hubbert approach to coal? Höök et al (2008)
Mt = millions of metric tons Production is now 16 times less than the peak, while the average price after the peak is 2.4 times higher than before In 1913, Britain exported 27% of its production, now it imports 74% of the coal it burns UK Coal Production
Historical Projections for UK Coal Reserve numbers are available before projections stabilize Produced 18% of the 1871 Royal Commission reserves + cumulative Criteria were too optimistic ― 1-ft seams, 4,000-ft depth (Deffeyes’ law) 44
The world’s proven reserves of coal are decreasing fast! Whenever coal reserves are updated the reserve estimates are revised downward (significantly). Not due to production, but rather more thorough geological surveys. Example: World Reserves by WEC decreased from 10 trillion tons to 4.2 trillion tons in 2005 Example: Gillette in Wyoming from 20.9 billion tons to 9.2 billion tons (2009) The energy content of coal mined is decreasing.
Projections vs Reserves for World Coal • UN IPCC scenarios assume 18Tboe is available for production from D. Rutledge
The scenario report SRES (2000) references the 1995 and 1998 WEC surveys Downward trend in proved recoverable reserves The IPCC chose to use additional recoverable reserves and they also chose 1998 (3,368Gt) instead of 1995 (680Gt) — additional recoverable reserves are now 19 times smaller than in 1998 Where Does the IPCC Get Its Coal Numbers?
Regional Fits vs Reserves, Gt 850 left to be mined IPCC range is 355 to 3500 in 2100 48
Many independent groups are coming to the same conclusion Uppsala – Kjell Aleklett Peak Coal in 2030 (examples follow) http://www.tsl.uu.se/uhdsg/Publications/Coalarticle.pdf Energy Watch Group (EWG-Germany) Peak Coal in 2025 http://www.energywatchgroup.org/files/Coalreport.pdf Institute of Energy (IFE) Kavakov and Peteves (2007) The Future of Coal http://ie.jrc.ec.europa.eu/ Richard Heinberg Post Carbon Institute (2009) “Blackout : Coal. Climate and the Last Energy Crisis” New Society Publishers