Download
1 / 27
270 likes | 383 Views
Frequency of Care. Shape of the Benefit-Utilization Curve: Supply-Sensitive Services. U.S. is some- where in this zone. Life Expectancy. i.e. The problem of unwarranted variation in treatment of chronic illness is a problem in overuse and waste, not underuse and health care rationing.

E N D
Frequency of Care Shape of the Benefit-Utilization Curve:Supply-Sensitive Services U.S. is some- where in this zone Life Expectancy
i.e. The problem of unwarranted variation in treatment of chronic illness is a problem inoveruse and waste, not underuse and health care rationing
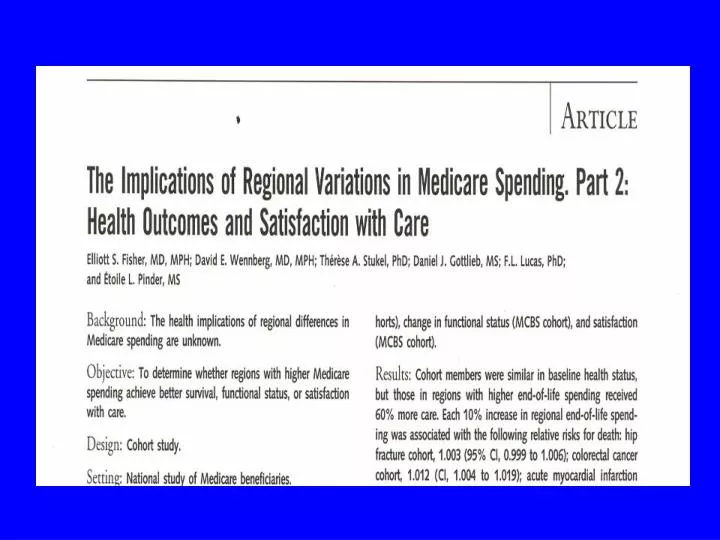
10,500 9,500 8,500 7,500 6,500 5,500 More than 15% Above Average 0-15% Above Average 4,500 0-15% Below Average More than 15% Below Average 3,500 What Does Greater Medicare Spending Buy?Medicare Per capita spending (306 regions: 2000-01)
2.0 1.66 1.6 1.38 1.18 1.2 1.04 1.03 Ratio to Lowest Spending Region 0.98 1.00 1.00 1.00 1.00 0.99 0.97 0.8 0.4 0.0 Medicare Reimbursements Effective Care Preference-Sensitive Care (Discretionary Surgery) What does Greater Per Capita Spending BUY?not more effective or preference-sensitive care More than 15% Below Average 0-15% Below Average 0-15% Above Average More than 15% Above Average
2.53 3.0 2.54 2.5 1.82 1.80 2.0 Ratio to Lowest Spending regions 1.69 1.41 1.41 1.5 1.26 1.23 1.00 1.00 1.00 1.0 0.5 0.0 Days in Hospital Medical Specialist Visits % Seeing 10 or More Doctors End of life care What does Greater Per Capita Spending BUY?More Supply-Sensitive Care!! More than 15% Below Average 0-15% Below Average 0-15% Above Average More than 15% Above Average
Reducing Overuse: supply sensitive care • Major focus: At patient level, active chronic disease management
Reducing Overuse: supply sensitive care • Major focus: At patient level, active chronic disease management • Major focus: At system level, control of capacity relative to size of population served
Reducing Overuse: supply sensitive care • Major focus: At patient level, active chronic disease management • Major focus: At system level, control of capacity relative to size of population served • Major Impediment: adverse economic impact on providers
28.0 24.0 20.0 16.0 12.0 8.0 Days in Hospitals During Last Six Months of Life Among Patients with severe chronic illness who received most of their care in one of 77 “best” U.S. hospitals
28.0 NYU Medical Center 27.1 24.0 Mount Sinai Hospital 22.8 NY Presbyterian Hospital 21.6 Cedars-Sinai Medical Center 21.3 20.0 Mass. General Hospital 16.5 UCLA Medical Center 16.1 Boston Medical Center 15.6 16.0 Brigham & Women's Hospital 13.9 Beth Israel Deaconess 12.2 UCSF Medical Center 11.5 Stanford University Hospital 10.1 12.0 8.0 Supply-Sensitive CareDays in Hospitals During Last Six Months of LifeAmong Patients assigned to Selected Academic Medical Centers
35.0 30.0 25.0 20.0 Hospital day rate: CHF patients 15.0 10.0 5.0 R = 0.64 2 0.0 0.0 5.0 10.0 15.0 20.0 25.0 30.0 35.0 Hospital day rate: Cancer patients Association Between Hospital Days for Cancer and for CHF patients during last six months of life: 77 Selected Academic Medical Centers
30.0 25.0 20.0 L6M hospital day rate: Black 15.0 10.0 R2 = 0.75 5.0 5.0 10.0 15.0 20.0 25.0 30.0 L6M hospital day rate: Non-Black Association between hospital days for black and non-black patients during last six months of life among 50 “best” hospitals
80.0 NYU Medical Center 76.2 70.0 Cedars-Sinai Medical Center 66.2 60.0 Mount Sinai Hospital 53.9 50.0 UCLA Medical Center 43.9 NY Presbyterian Hospital 40.3 Mass. General Hospital 38.8 40.0 Brigham & Women's Hospital 31.9 Boston Medical Center 31.5 Beth Israel Deaconess 29.2 UCSF Medical Center 27.2 Stanford University Hospital 22.6 30.0 20.0 10.0 Supply-Sensitive CarePhysician Visits During the Last Six Months of Life Among Patients assigned to Selected Academic Medical Centers
80.0 70.0 60.0 50.0 Physician Visit Rate 40.0 30.0 20.0 R2 = 0.60 10.0 5.0 10.0 15.0 20.0 25.0 30.0 Hospital Day Rate Association Between Hospital Days and Physician Visits During the Last Six Months of Life among patients receiving most of their care in one of 77 “best” U.S. hospitals
65.0 Mount Sinai Hospital 58.5 NYU Medical Center 57.1 55.0 UCLA Medical Center 50.9 Cedars-Sinai Medical Center 48.2 45.0 NY Presbyterian Hospital 37.7 35.0 UCSF Medical Center 30.3 25.0 Stanford University Hospital 23.1 15.0 Percent seeing 10 or more physicians during last six months of life among patients receiving most of their care in one of 77 “best” U.S. hospitals
40,000 35,000 30,000 25,000 Payment in Last 6 Months 20,000 15,000 10,000 R2 = 0.79 5,000 1,500 3,500 5,500 7,500 Payments 19-24 Mos. Before Death Association Between Medicare inpatient + Part B Payments 19-24 Months and 0-6 Months Before Death: 77 hospital cohorts (1999-01).
28.0 NYU Medical Center 24.6 24.0 Cedars-Sinai Medical Center 20.7 20.0 Mount Sinai Hospital 16.4 UCLA Medical Center 14.6 New York Presbyterian 13.8 16.0 12.0 UCSF Medical Center 9.2 Stanford University Hospital 8.7 8.0 4.0 Primary care + medical specialist S-FTE inputs per 1,000 Medicare decedents: last six months of life among selected hospitals
28.0 NYU Medical Center 1.70 24.0 Cedars-Sinai Medical Center 2.19 20.0 Mount Sinai Hospital 1.10 UCLA Medical Center 2.86 New York Presbyterian 1.05 16.0 12.0 UCSF Medical Center 0.67 Stanford University Hospital 1.31 8.0 4.0 Ratio: medical specialist/primary care
65,000 55,000 45,000 35,000 25,000 15,000 All other ($18,165) Tenet ($29,003) CHW ($16,824) Sutter ($17,035) Adven- tist ($18,422) St. Joseph ($14,691) Kaiser ($13,445) Univ. of CA ($27,218) Daughters of Charity ($23,727) HCA ($18,942) Scripps ($16,795) 5,000 Medicare reimbursements per decedent during the last six months of life among California hospitals (weighted average in parentheses) (1999-2003)
32.0 29.0 26.0 23.0 20.0 17.0 14.0 11.0 8.0 5.0 All other (13.6) Tenet (16.9) CHW (12.6) Sutter (11.4) Adven- tist (13.3) St. Joseph (12.0) Kaiser (10.1) Univ. of CA (14.2) Daughters of Charity (15.9) HCA (15.0) Scripps (13.1) Hospital days per decedent during the last six months of life among California hospitals (weighted average in parentheses) (1999-2003)
40,000 35,000 30,000 Total Payment in Last 6 Months 25,000 20,000 15,000 10,000 R2 = 0.79 5,000 1,500 3,500 5,500 7,500 Total Payments 18-24 Mos. Before Death Association Between Total Medicare Payments 18-24 Months and 0-6 Months Before Death: 77 hospital cohorts (1999-01).
What Preferred Providers should be asked to do: • Eliminate Underservice of Effective Care • Reduce Medical Mistakes • Learn What Works (Outcomes Research) • Assure Informed Patient Choice (Shared Decision Making) • Achieve Efficient and Effective Management of Supply-Sensitive Care (Target: Chronic Disease) • Achieve Efficient Allocation of Resources geared to Size of the Population Served
Thank You!!!!! Dartmouthatlas.org