Download
1 / 80
820 likes | 1.25k Views
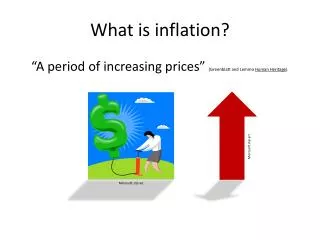
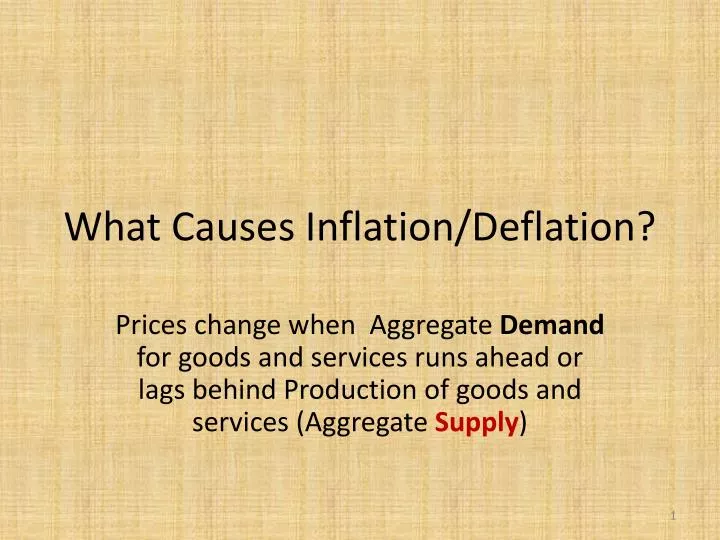
What Causes Inflation/Deflation?. Prices change when Aggregate Demand for goods and services runs ahead or lags behind Production of goods and services (Aggregate Supply ). Aggregate Supply – Aggregate Demand. Aggregate Supply. CPI. Goods and Services Produced.

E N D
What Causes Inflation/Deflation? Prices change when Aggregate Demand for goods and services runs ahead or lags behind Production of goods and services (Aggregate Supply)
Aggregate Supply – Aggregate Demand Aggregate Supply CPI Goods and Services Produced At this price level all production is sold: no accumulation of inventories At this price level Aggregate Supply = Aggregate Demand CPIo Aggregate Demand Goods and Services Purchased GDPo Real GDP
Increase Production Aggregate Supply Produce More Supply larger than Demand: Inventories rise, Firms cut prices CPIo CPI1 Aggregate Demand GDP1 Supply Demand GDPo GDPo Supply
‘Good’ Inflation Optimistic consumers buy more goods and services Aggregate Supply Goods and Services Produced Buy More Demandhigher than Supply: Inventories Drop, prices and output rise CPI1 Inflation CPIo Aggregate Demand Goods and Services Purchased GDPo GDP1 Unemployment drops Growth Supply Demand
Bad Inflation Firms can not get loans Stagflation Aggregate Supply Goods and Services Produced Produce Less Demandhigher than Supply: Inventories Drop, prices rise, output drops CPI1 Inflation CPIo Aggregate Demand Goods and Services Purchased GDP1 GDPo Unemployment increases Recession Supply Demand
Deflation • Before 1930 deflation was as likely as inflation. • Deflation is harmless even good, if lower prices lift real incomes and hence spending power. • In the last 30 years of the 19th century, consumer prices fell by almost half as the expansion of railways and advances in industrial technology brought cheaper ways to make everything. • Annual real GDP GROWTH over the period averaged more than 4%.
Advances in technology reduce costs Good Deflation Aggregate Supply Produce More Supply larger than Demand: Inventories rise, prices drop, output rises CPIo Deflation CPI1 Aggregate Demand GDPo GDP1 Unemployment drops Growth
Consumers feel poor as real estate and stock prices fall Bad Deflation Goods and Services Produced Buy Less Supply larger than Demand: Inventories rise, prices and output drop CPIo Deflation CPI1 Goods and Services Purchased GDP1 GDPo Unemployment increases Recession
Deflation is dangerous when it reflects • A sharp drop in DEMAND, • Excess CAPACITY and • Decrease in GDP As in the Great DEPRESSION of the early 1930s.
The Shape of the Aggregate Supply Curve The book uses an upward sloping AS curve…is this always the case? Why is it upward sloping?
The Shape of the Aggregate Supply Curve AS: describes the reaction of firms to changes in demand.
Unemployed workers: wages lowExcess capacity: easy to produce more. Firms do NOT raise prices but instead increase output The Effect of an Increase in Aggregate Demand Lower Unemployment: wages riseLess excess capacity: costs rise as firms produce more. To cover increase in costs, firms raise prices Only Prices rise Minimal Unemployment no excess capacity No Unemployment: wages rise fasterNo excess capacity: Firms cannot produce more, only increase prices Lower Unemployment and less excess capacity Prices Increase Prices do not change Unemployment and Excess Capacity Output Increases Output Increases Output can not increase
The book uses an upward sloping AS curve…is this always the case? • NO. The reaction of firms depends on where the economy is along the business cycle. • During a Recession (high Unemployment and Excess Capacity) AS is horizontal • Wages do not rise due to unemployment • Firms can increase production without raising prices.
Why is AS upward sloping? During the Recovery with lower unemployment and less excess capacity: AS is upward sloping • Firms can increase output • But costs rise: lower unemployment means that hiring workers becomes more expensive and equipment breaks down more often. • Firms increase both production and prices (to cover increase in costs).
The book uses an upward sloping AS curve…is this always the case? NO. The reaction of firms depends on where the economy is along the business cycle. At full employment with zerocyclicalUnemploymentand NO Excess Capacity: AS is vertical. Firms can no longer increase production. • And costs rise: zero unemployment means that firms must hire workers away from other firms and equipment breaks down more often. Firms increase prices
Recession and deflation Recession and inflation Growth and deflation Growth and inflation Price Level Price Level AS1 ASo ASo 1 2 AD1 ADo ADo Real GDP Real GDP Price Level Price Level ASo AS1 ASo 4 3 ADo AD1 ADo Real GDP Real GDP
AS shifts more thanAD AD shifts more thanAS S1 S1 S2 E2 S2 E1 E1 P E2 D2 D2 D1 D1 GDP All three graphs show the effect on prices and output when both AS and AD increase: Depending on the relative size of the shifts, prices may go up, down or remain the same. Output definitely increase. AS shifts by the same amount as AD S1 S2 E1 E2 D2 D1
Recession and inflation Growth and inflation Recession and deflation S2 3 S1 E2 E1 E2 D1 E1 D2 Growth and deflation P S2 3 E2 S1 E1 E2 D2 E1 D1 Y (C)
Use AD-AS to show the effect on prices and output • The Aggregate Demand induced Great Depression of the 1930’s. • A negative supply shock as that experienced during the 1970’s when oil prices sky rocketed. • The combined effects of improvements in technology and increasing government spending. • The combined effects of the financial system meltdown and plummeting home values. • Increase Government Spending in construction projects. • Natural disaster – earthquake, nuclear meltdown- • Decrease in payroll tax.
Stabilization Policy: Use AS – AD diagram to: • Explain how the government can fight inflation. What negative consequence may this policy have? • Explain how the government can fight unemployment. What negative consequence may this policy have? • Explain how the government can fight recessions. What negative consequence may this policy have?
Draw three possible graphs: • Aggregate Demand and Aggregate Supply increase. • Aggregate Demand and Aggregate Supply decrease. • Aggregate Demand decrease and Aggregate Supply increase. • Aggregate Demand increase and Aggregate Supply decrease.
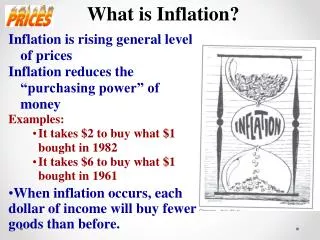
The Costs of Inflation Why is inflation bad? Obviously, because money buys less
Cost of Inflation THREE MISTAKES
Wages and prices rise and fall together. Wages 1. People believe inflation decrease real wages If salaries rise @ the inflation rate, real wages do not change Prices Inflation does not decrease real wages.
The “Robbery Coefficient” 2. Workers believe they “earned” 5% and inflation “robbed” them of 2%” Increase in wages = Increase in productivity + increase in prices Increase in productivity = 3% Inflation = 2% Increase in wages = 2+3 = 5% Only 3% is “earned” by my stellar performance (productivity). The remaining 2% is given to keep real wage from falling due to rising prices. What you get for your stellar performance What you get to compensate you for rising prices
Inflation is blamed for changes in relative prices 3. The apple seller blames inflation for the drop in his buying power. Suppose the price of apples = price gasoline = $2. 1 bag of apples buys you 1 gallon of gas. Basket: 1 bag of apples, 1 gallon of gas. Cost of basket: (1X$2)+ (1X$2) = $4 CPI = ($4/$4)*100 = 100 If the price of gas rises to $3 while the price of apples drops to $1. The apple seller now needs 3 bags of apples to buy 1gallon of gas. Cost of basket: (1X$1)+ (1X$3) = $4 CPI = ($4/$4)*100 = 100 There is NO inflation but a change in relative prices Only if OVERALL prices rise, there is inflation
The True Costs of Inflation Why is inflation bad?
A $1.45 increase in 73 years! Real Min Wage Nominal Min Wage 1938 Nominal Min Wage $0.25 CPI = 14.1 Real Min Wage = $1.77 2011 Nominal Min Wage $7.25 CPI = 224.9 Real Min Wage = $3.22
Arbitrary redistribution of income from minimum wage workers to employers Inflation 1. Inflation Costs: Arbitrary Redistribution of Income • Individuals whose incomes are fixed (pensions) or grow slower than inflation (minimum wage) lose purchasing power. • Employers who enjoyed sale prices rising faster than wages win… Arbitrary redistribution of income from retirees to government, businesses
Interest Rate The reward for those who give up spending today in order to spend tomorrow The cost paid by those who want/need to spend today money they will make in the future.
$10 is my reward for postponing consumption. The Inflation Cost • If I save $100 today at 10% interest • I will get $100 + 100 (0.1) = 100 + 10 = $110 when I need the money (retirement). • If inflation is zero, I will have an extra $10 to spend.
5% Inflation = CPI increase by 5% CPI = 100 CPI = 100+ 100*0.05 =105 Today Future Multiply by 1.05 (105)/(100) =1.05 ? $100(1.05) = $105 $100
The borrower is very happy. He returned “less” than he borrowed! 10% interest means I will get $110 in the future… The borrower is happy. He used my money for free! • If inflation is5%I need $105 to buy what I could buy with $100 before. I get $110, so I got only $5 extrato spend. • If inflation is 10%, I now need $110 to buy what I could buy with $100 before. I get $110 so I got nothing in return for my savings! Inflation steals 5% of my 10% interest Inflation Cost me ALL my reward! • If inflation is 20%, I now need $120 to buy what I could buy with $100. I get $110, but that buys less than the $100 I lent! Inflation Cost me 10% more than I got in interest
All I need to do is charge the correct Nominal rate! All I need to know is the inflation rate… The Real Interest Rate The interest rate written in a contract between lender and borrower -10% 10% 0% 10% RealInterest Rate = Nominal Interest Rate – Inflation Rate. 10% 20% 0%
What is your guess for inflation in 2014? Average=2.32 3 ?
Guess Inflation = 3% Charge 7% nominal interest • If you guess right, and inflation is 3%, you will make a 4% real return. Nominal (7%) – Inflation (3%) = Real(4%) • If you guess wrong and inflation is 5%,you will make a 2% real return Nominal (7%) – Inflation (5%) = Real(2%)
Inflation was 26% Average=2.32 26!
Guess Inflation = 3% Charge 7% nominal interest • If you are very wrong and inflation is 26%, you will make a negative return (you are giving money away!) Nominal (7%) – Inflation (26%) = Real(-19%)
Un-anticipated inflation hurts savers Return Less than they borrowed Savers Savings Nominal Interest Borrowers Inflation higher than nominal interest Real interest rate is negative
Arbitrary redistribution of income from savers to borrowers Inflation 2.Inflation Cost: Arbitrary Redistribution of Income • People who save lose purchasing power. • Borrowers win
What is your guess for inflation next year (2006) if you live in this country?
What is your guess for inflation next year (2006) if you live in this country?
U.S. Last 20 years Between 1% and 6% What is your guess for inflation next year?
Venezuela Between 10% and 120%
Your guess if you live in this country? Between -10% and 50%
Ecuador Between -5% and 50%