Download
1 / 4
40 likes | 125 Views
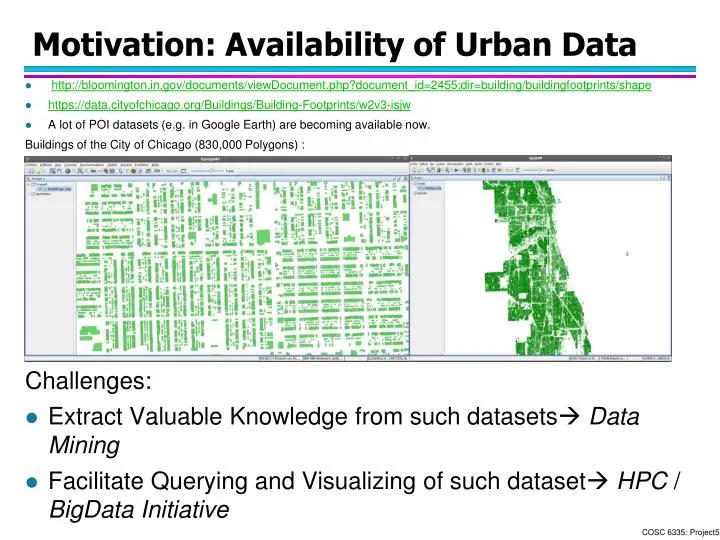
Motivation: Availability of Urban Data . http :// bloomington.in.gov/documents/viewDocument.php?document_id=2455;dir=building/buildingfootprints/shape https:// data.cityofchicago.org/Buildings/Building-Footprints/w2v3-isjw

E N D
Motivation: Availability of Urban Data • http://bloomington.in.gov/documents/viewDocument.php?document_id=2455;dir=building/buildingfootprints/shape • https://data.cityofchicago.org/Buildings/Building-Footprints/w2v3-isjw • A lot of POI datasets (e.g. in Google Earth) are becoming available now. Buildings of the City of Chicago (830,000 Polygons) : Challenges: • Extract Valuable Knowledge from such datasets Data Mining • Facilitate Querying and Visualizing of such dataset HPC / BigData Initiative
Project5 Questions for Dataset Zinj • Are buildings randomly distributed or is there some clustering? • Are buildings of the same building type collocated, anti-collocated or not? • Are building belonging to different building types collocated, anti-collocated or not—for example, you will try to answer the question if garages are collocated with commercial buildings. • Idea to answer question: create curves based on number of objects within the radius of another object/kNN-distance,… and obtain answers by comparing curves generated for different contexts. See: http://wiki.landscapetoolbox.org/doku.php/spatial_analysis_methods:ripley_s_k_and_pair_correlation_function
Example: Collocation Red and Green Objects FOR radii r1,…,rn DO FOR all green objects g DO Compute #-of-red objects within radius rj of g ENDDO Compute average rojof values observed in previous loop Put entry (rj, (roj/total_number_of_red_objects)) into Curve ENDDO
An Alternative Approach Using k-Nearest-Neighbor Distance FOR k=k1,…,krDO FOR all green objects gp DO Compute distance rdp to k-nearest red object to g ENDDO Compute average rdiof values observed in previous loop Put entry (ki, rdi) into the Curve ENDDO Remark: For k-values use 0.1% of the red objects; 0.1*1.5 of the red objects, 0.1%*1.52 of the red objects, 0.1%*1.53 of the red objects,…, until at most 50% of the red objects—with x being the ceiling function computing the smallest integer that is greater equal than x. d6 d3 d1