Download
1 / 9
100 likes | 244 Views
Foldable Directions. For a set of data…. Very Top Tab. Order the numbers from least to greatest. Second Tab. MEAN Average- Your “mean” teacher averages your grades. Add up all the numbers and divide by the # of items in your data set. Third Tab. MEDIAN The middle number.

E N D
Foldable Directions For a set of data…
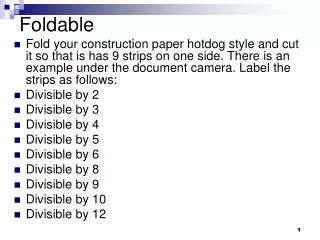
Very Top Tab • Order the numbers from least to greatest.
Second Tab • MEAN • Average- Your “mean” teacher averages your grades. • Add up all the numbers and divide by the # of items in your data set.
Third Tab • MEDIAN • The middle number. • Mark out the first and last numbers until you get to the middle. • If there are 2 numbers left in the middle, add them together and divide by 2. • The median divides the data into an upper half and a lower half.
Fourth Tab • MODE • Occurs most often • If no # is listed more than once, there is NO MODE. • There can be more than one mode.
Fifth Tab • RANGE • The difference between the highest and lowest #’s in the data set. • Highest # - Lowest # = Range
Sixth Tab • UPPER QUARTILE • UQ • The middle # of the upper half of the data (to the right of the median) • Cross out first and last #’s until you get to the middle #. • If there are 2 #’s in the middle, add them together and divide by 2.
Seventh Tab • LOWER QUARTILE • LQ • The middle # of the lower half of the data (to the left of the median) • Cross out first and last #’s until you get to the middle #. • If there are 2 #’s in the middle, add them together and divide by 2.
Eighth Tab • INTERQUARTILE RANGE • IQR • The difference between the upper quartile and the lower quartile. • UQ – LQ = IQR