Download

1 / 21
210 likes | 282 Views
Estimating cancer survival and clinical outcome based on genetic tumor progression scores. Jörg Rahnenführer 1,*, Niko Beerenwinkel 1, , Wolfgang A. Schulz 2, Christian Hartmann 3, Andreas von Deimling 3, Bernd Wullich 4 and Thomas Lengauer 1 Presented by Rahul Jawa. Motivation.

E N D
Estimating cancer survival and clinical outcome based on genetic tumor progression scores Jörg Rahnenführer 1,*, Niko Beerenwinkel 1,, Wolfgang A. Schulz 2, Christian Hartmann 3, Andreas von Deimling 3, Bernd Wullich 4 and Thomas Lengauer 1 Presented by Rahul Jawa
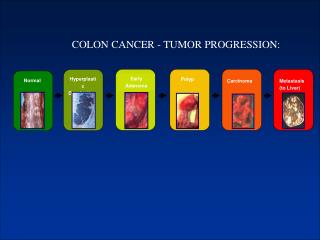
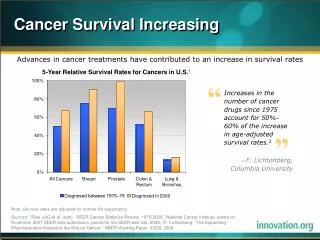
Motivation • Prediction of time to death or relapse is important for tumor classification and selecting appropriate therapies • Survival Prediction based on clinical and histological parameters • Accumulation of genetic alterations during tumor progression can be used for the Assessment of the genetic status of the tumor • Evolutionary tree models have been applied for modeling dependences between the genetic events
Methods • Oncogenetic Tree Models • Describes order of genetic events in the course of human tumor development • Genetic events are gains or losses of parts of chromosomes • Oncogenetic tree T = (V, E, r, p) • Problem: Fixed pattern, therefore some samples are assigned probability zero
Methods (contd) • Oncogenetic trees mixture models • Contains a star topology which models spontaneous and independent occurrence of genetic events • And arbitrary trees estimated from the observed data • This model is learned by an EM-like fashion by iteratively estimating the responsibilities of the different tree components for the data and the structure and parameters of the tree models are inferred from the weighted data
Methods (contd) • Genetic progression scores (3) • Determines the progression status of human tumors • They are defined for tumor samples that are represented by binary vectors indicating the occurrence of a list of genetic events(x1,…,xl)
Methods (contd) • Count Statistic • Measure of genetic progression = number of events that have occurred • All events are independent and impact on progression is cumulative
Methods (contd) B. Weighted count statistic • All genetic events are not equally important • High frequent events occur early • Less frequent events indicates more advanced progression
Methods (contd) C. Genetic progression score • Used via Oncogenetic trees mixed model to integrate dependences between ordered events • A timed oncogenetic tree is obtained by assuming independent Poisson processes for the occurrence of events on the tree edges • Expected waiting time of a pattern is finally estimated as the average of all waiting times at which pattern is observed
Methods (contd) • Survival analysis • Survival time starts at time of treatment and the endpoint is the death or relapse • If patient drops out before endpoint, the Cox proportional hazard model can be used to calculate risk of death • Hazard rate at a time t is the instantaneous rate of death during the next instant of time among survivors to time t • Lambda0 is the baseline hazard function • B = (B1,…,Bp) is the vector of regression coefficients • z = (z1,…zp) is a p-dimensional vector of covariates that are potential predictors for the survival time
Data Sets • Glioblastomas (Brain Tumor) • Survival time based on death • Contained 75 patients with 5 censored • Genetic events were chromosome changes on the p-arm or q-arm of single chromosomes • Selected the events that were observed in at least 15% of the tumor samples • 10q, 10p, 9p, 19q, 17p, 13q and 22q
Data Sets (contd) • Prostate cancer • Survival time based on tumor relapse • Contained 54 patients and 34 censored • Genetic events were gains and losses of chromosome parts on the p-arm or q-arm of all chromosomes • Selected the events that were observed in at least 10% of the tumor samples • 3q+, 4q+, 6q+, 7q+, 8p-, 8q+, 10q-, 13q+ and Xq+
Results • Estimated oncogenetic tree model for Glioblastomas
Results (contd) • Estimated oncogenetic tree model for Prostate cancer
Results (contd) • Cox proportional hazard models • Is used to identify genetic markers that are relevant for estimating clinical outcome • Hazard ratio quantifies the relative risk of death
Results (contd) • GPS for Glioblastomas • Table 1 Glioblastoma data set: pattern of observed LOH measurements for selected events, frequency of pattern and GPS calculated from oncogenetic tree model • Table 2 Glioblastoma dataset: genetic events defined by LOH on single chromosomes, frequencies and p-values in Cox models (original and false discovery rate adjusted in univariate and original in multivariate model) • Table 3 Glioblastoma dataset: GPS with hazard ratios, 95% confidence intervals and p-values in univariate and bivariate Cox regression model
Results (contd) • GPS for Prostate cancer • Gleason score is a prostate cancer grading system on scale 1-10 • Table 4 Prostate cancer dataset: pattern of observed CGH measurements for selected events, frequency of pattern and GPS calculated from oncogenetic tree model • Table 5 Prostate cancer dataset: genetic events defined by CGH on single chromosomes, frequencies and p-values in Cox models (original and false discovery rate adjusted in univariate and original in multivariate model) • Table 6 Prostate cancer dataset: genetic progression scores with hazard ratios, 95% confidence intervals and p-values in univariate and bivariate Cox regression model
Conclusion • The GPS of a tumor gave the estimated average waiting time of its observed genetic pattern in the timed oncogenetic tree • GPS was able to differenciate patient subgroups with respect to expected clinical outcome • GPS was applied to two different tumor types which shows that it could become a universal approach • For Gleason score of 7, GPS was able to further identify subgroups