Download
1 / 23
240 likes | 393 Views
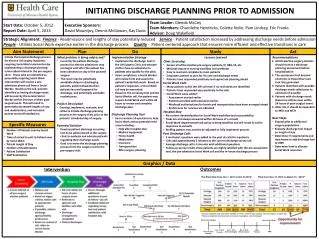
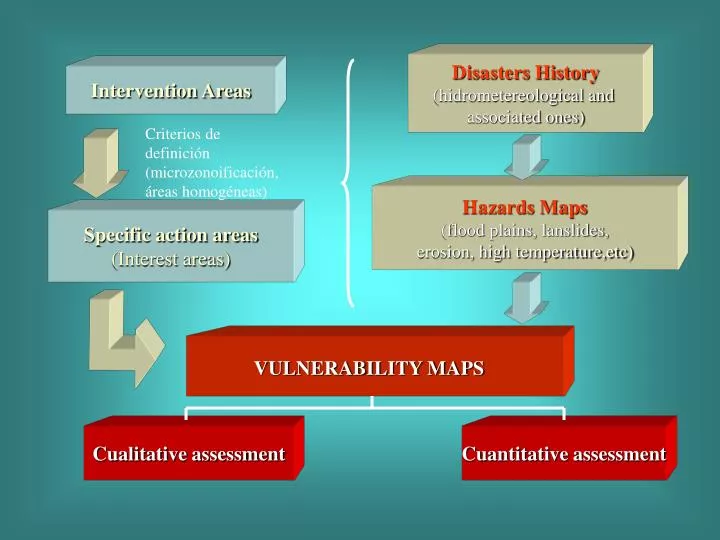
Disasters History (hidrometereological and associated ones). Intervention Areas. Criterios de definición (microzonoificación, áreas homogéneas). Hazards Maps (flood plains, lanslides, erosion, high temperature,etc). Specific action areas (Interest areas). VULNERABILITY MAPS.

E N D
Disasters History (hidrometereological and associated ones) Intervention Areas Criterios de definición (microzonoificación, áreas homogéneas) Hazards Maps (flood plains, lanslides, erosion, high temperature,etc) Specific action areas (Interest areas) VULNERABILITY MAPS Cualitative assessment Cuantitative assessment
Ejemplo de indicadores cuantitativosde evaluación de vulnerabilidad (1) • Empleo: horas/h, jornales/ha, US$ • Inversión : créditos no pagados, US$/ha no invertido, nº de créditos • Areas en producción : has/producto, US$/ha, Tm/producto • Productividad :tn/ha, US$/ha • Económicos: precios (reales, nominales,constantes) • Exportaciones, importaciones: Tn, US$, %PBI (FOB o CIF) • Sociales: horas de clase perdidas, fam. Afectadas, viviendas afecytadas (US$/viv) (1) Estos indicadores normalmente se establecen por el equipo de trabajo, en función al objetivo del mismo
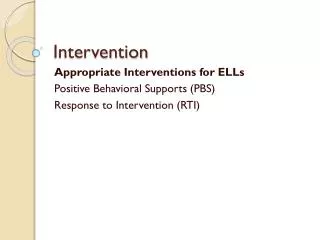
Vulnerability • Territorial and Agriculture • Coastal areas and fisheries • Socio economical (includes sociohuman development –gender analysis)
Mapa Hidrológico Mapa Geológico Current land use
Vulnerability • Territorial and Agriculture • Coastal areas and fisheries • Socio economical (includes sociohuman development –gender analysis)
Sea Surface Temperature (°C) in Ensenada de Sechura, during summer and winter surveys 2004 Fisheries Desimbarking by port
How the recurrency of ENSO affects the fisheries sector? • Extinctio or migration of native and endemic species of coastal fishes and marine invertebrates. • Diminishing of exportation volumes from US$ 324' 812,000 in 1997 to 139' 157,000 in 1998. • Entry of new tropical species • Lack of market supplies and fall down of main human consumption species. • Increase of the stock of some commercial fisheries
Vulnerability • Territorial and Agriculture • Coastal areas and fisheries • Socio economical (includes sociohuman development –gender analysis)
1970-79 1980-89 1990-99 Spatial Incidence of floods (1970-2003) 1980-89 1970-79 In the first two decades floods affects the lower zone of the river bain . Flooding has been increasing mainly to areas of higher altitude (middle and upper parts of the river basin) Floods in the upper part of the river basin occurs know at right margin 1990-99
Spatial Incidence of landslides and huaycos (water and mudslides) (1970-2003) 1980-89 1970-79 1970-79 1980-89 In 1970-79 the events were in the upper river basin. In 1980-89, big areas of the middle part of the river basin were affected. In 1990-99, the most significative problems were in the middle and upper river basin 1990-99 1990-99
Irrigation Infrastructure and croplands in floods areas Low lands in flood risk areas Big part of productive lands in flood risk areas
Transportation infrastructure and Energy generation facilities in flood risk areas Highways and bridges associated to mango exportation in high risk flood areas Nergy generation facilities in high risk flood areas
Retreat of Glacier Surface in the cordillera blanca 1970-1997 (27 años): 15.46% 1997 según inventario en base a imágenes satelitales (INAGGA) - 111,89 Km2 723.37 Km2 611.48 Km2
Maximum Previsíon según los datos 1980 - 2000 Previsión según los datos 1950 - 2000 Pucajirca, 6050 m