Download
1 / 46
460 likes | 636 Views
Regional Consequences of Climate and Land Use Change on Ecosystem Services in Pennsylvania. Benjamin Felzer. Outline of Talk. Introduction: Environmental Stresses and Ecosystem Services Description of Tools: Models and Data Model Validation Role of climate and land use change in PA

E N D
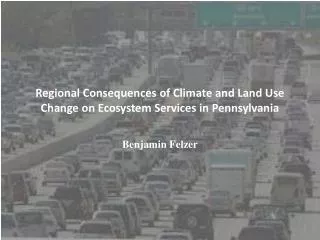
Regional Consequences of Climate and Land Use Change on Ecosystem Services in Pennsylvania Benjamin Felzer
Outline of Talk • Introduction: Environmental Stresses and Ecosystem Services • Description of Tools: Models and Data • Model Validation • Role of climate and land use change in PA • Future climate extremes and flooding in the Lehigh Valley • Historical Multiple Factorial Effects in the Mid-Atlantic
Environmental Stresses • Rising atmospheric CO2 • Climate variability and change • Land use cover and change • Nitrogen deposition and fertilizer • Ozone near surface
CO2 and Climate (Raich et al., 1991)
Forest Regrowth Poplar, WI Pine, FL (Pan et al., 2002)
Nitrogen and Ozone Tulip Poplar (Magnani et al., 2007) (Lombardozziet al., 2012)
Carbon Accounting Net Ecosystem Productivity (NEP) = NPP – rh where NPP = Net Primary Productivity rh = heterotrophic respiration Net Carbon Exchange (NCE) = NEP – ec – ep where ec = carbon lost due to conversion ep= carbon lost due to decomposition of products Positive NEP, NCE means land is carbon sink Generally neutral (Odum, 1969) or small sink (Luyssaert et al., 2008) or small source (Law et al. 2004) for mature forest.
Description of Tools: Models and Data • Biogeochemical Model (TEM-Hydro) • Climate Data • Land Cover Data
TEM-Hydro Model Atmosphere Water Carbon Transp. GPP Rg Rm Rh Vegetation Precip. Carbon LTRC Nitrogen Soil Evap. N uptake LTRN Water Nitrogen Carbon Soil Runoff (Felzer et al, 2009, 2011)
Disturbance • Cohort Approach • Slash: input to soils • Residue: to atmosphere • Product Pools (1, 10, 100 years): decomposition rates Open Nitrogen • Inputs: N fixation, N deposition, N fertilizer • Outputs: Leaching of Dissolved Organic Nitrogen (DON) and Dissolved Inorganic Nitrogen
Inputs and Calibration • Climate (Cloud or Radiation, Temperature, Precipitation, ozone, carbon dioxide (global annual value)) • Vegetation Cohorts • Soil and Elevation (static) • Calibration of carbon and nitrogen parameters to target values of carbon and nitrogen stocks and fluxes
Model Validation • Streamflow at Watersheds • Eddy Covariance (Ameriflux) NEE (Net Ecosystem Exchange) and ET (Evapotranspiration) • Gridded Datasets combining Eddy Covariance and Remote Sensing (EC-MOD, Fluxnet-MTE)
Eastern U.S. Forests (Felzer et al., 2009)
Willow Creek, WI (b) (a) (c) (d)
Validation: without land use disturbance Felzer and Sahagian, Climate Research, in review
Trend Comparison: Evapotransporation Accounting for significant, 72% grids Not accounting for significant, 60% grids
Seasonal Validation Felzer and Sahagian, Climate Research, in review
PA Study (Felzer et al., 2012)
Rodale-based Dairy Farm Parameterization (Jiang and Zhang, in prep.)
Measured Rodale dairy pasture targeting values Ra: 554 g C yr-1 m-2 Rh: 1685 g C yr-1m-2 GPP: 1020 g C yr-1m-2 NPP: 466 g C yr-1m-2 Vegetation C: 922 g C m-2 Vegetation N: 57.8 g N m-2 Available N: 3.3 g N m-2Soil C: 2559 g C m-2Soil N: 360 g N m-2
Flooding in Lehigh Valley Future bias-corrected NCAR CESM storm statistic Historical NCDC storm statistic HEC-HMS peak stream discharge Monocacy Creek HEC-RAS Flood Profiles (Felzer, Schneck, Withers, and Holland in preparation)
24 Hour Storm Event (inches)
Effects of Human Disturbance on Carbon: Eastern U.S. (Dangal et al., 2013)
Net Ecosystem Productivity (NEP) Validation (Table from Dangalet al., 2013)
Multifactorial Experimental Design for MidAtlantic S1-S0 = LULC S2-S1 = CO2 S3-S2 = Climate S4-S3 = O3 S5-S4 = Ndep
Feedbacks of Carbon on Water Transpiration Runoff Photosynthesis Elevated CO2 Nitrogen limitation positive coupling: amplifying Ozone exposure negative coupling: dampening Ball-Berry Model: gc = gminLAI+ ga(GPP) (RH)/ [CO2]
Key Results • Increased urbanization and climate change in PA results in more runoff while increased urbanization results in more DIN leaching • Useful to use future storm scenarios to determine enhanced flooding in local watersheds • Comparing models to eddy covariance data requires accounting for forest disturbance • Carbon storage has decreased due to LULC, climate, and ozone, but increased due to CO2 and Ndep in the Mid-Atlantic since 1700 • Runoff has increased due to LULC and slightly due to CO2 and ozone • Model underestimating carbon sink?
Thanks! M.S. Students: Shree Dangal Ph.D. Students: Mingkai Jiang, Jien Zhang, Travis Andrews Postdoc:Eungul Lee Research Associate: ZavarehKothavala Undergraduates: Lauren Schneck, Cathy Withers, David Kolvek, Trista Barthol, Peter Phelps, Jonathan Chang Co-Authors: T. Cronin, J. Melillo, D. Kicklighter, A. Schlosser, D. Sahagian, M. Hurteau Assistance: B. Hargreaves, D. Morris, D. Sahagian Funding Agencies: MIT, Westwind Foundation, Lehigh University, DOE (Basic Research and Modeling to Support Integrated Assessment), NSF (Macrosystems Biology). Computational Time: NSF Yellowstone supercluster at Computational and Information Systems Laboratory (CISL)
TEM-Hydro Reduced Form Open Nitrogen Rh NonSymbiotic Nfix GPP Ra SOC Soil Organic Matter SOC LtrN LtrC VEGN VEGC SON Symbiotic Nfix NetNmin DOCprod DONprod VegNup DOC DON AvailN Ndep Fert. LeachDOC LeachDON LeachDIN (Felzer et al., 2012)
TEM Inputs Transient Datasets • Cloud or Radiation, Temperature, Precipitation, ozone, carbon dioxide (global annual value) • Vegetation cohorts Static Datasets • soil texture, elevation Parameter Files • soil, rooting depth, vegetation, vegetation mosaics, leaf, microbe, agriculture, calibrated biome files
TEM Calibration Stocks • Vegetation Carbon, Vegetation Nitrogen, Soil Organic Carbon, Soil Organic Nitrogen, Soil Inorganic Nitrogen Fluxes • NPP, N-saturated NPP, GPP, Plant Nitrogen Uptake Parameters • CMAX (photosynthesis), NMAX (N uptake), KD (heterotrophic respiration), NUP (Net N mineralization), KR (autotrophic respiration)
Climate Data Historical 20th century • CRU (Climatic Research Unit) 0.5o, monthly,1901-2009 • PRISM (Parameter-elevation Regressions on Independent Slopes) 1/24o, monthly, 1890-2013 Future IPCC Scenarios • AR4: A2, (A1B, B1) • Downscaled/Bias-Corrected Surface Temperature and Precipitation CMIP3 (Maurer): 1/8o, monthly, 1950-2099 • Delta/Ratio downscaling of Vapor Pressure and Net Irradiance
Carbon Atmosphere GPP Rg Rm Rh Vegetation Leaf Active Stem Labile Pool Allocation Senescence Root Inactive Stem LTRC Soil (Felzer et al, 2009, 2011)
Nitrogen Vegetation Leaf Nresorb Active Stem Labile Pool Allocation Senescence Root Inactive Stem VNUP LTRN Immobilization Mineral Organic Mineralization Soil (Felzer et al, 2009, 2011)
Water Shuttleworth-Wallace method Screen height, known T, VPR Canopy airspace, in contact with leaves and soil Atmosphere Surface of “big leaf” Soil Surface Transp. Vegetation canopy-to-screen height aerodynamic resistance Precip. Transp. leaf-to-canopy aerodynamic resistance Soil Evap. Soil Evap. soil-to-canopy aerodynamic resistance stomatal resistance Field Capacity Runoff soil internal resistance Wilting Point Soil: Bucket Model (Felzer et al, 2009, 2011)