Download
1 / 27
270 likes | 468 Views
Measuring the Size of Proton-Proton Collisions. Thomas D. Gutierrez University of California, Davis March 14, 2002 Department of Physics Sonoma State University. Quarks knocked loose during a collision quickly form bound states through a process called “ hadronization ”.

E N D
Measuring the Size of Proton-Proton Collisions Thomas D. Gutierrez University of California, Davis March 14, 2002 Department of Physics Sonoma State University
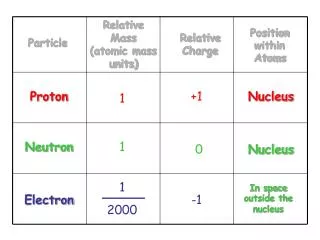
Quarks knocked loose during a collision quickly form bound states through a process called “hadronization”... Hadrons = Made of quarks Free quarks have never been observed! This is interesting and strange… Baryon = qqq p = uud n = dud Meson = qq p+ = ud K+ = us “A neutron is a dud…” Particle Physics at a Glance http://particleadventure.org
Particle Accelerators allow us to study aspects of the early universe in the lab “Hadronization of the universe” occurred here
Graphic courtesy JLK Perspectives on Temperature Nucleus-Nucleus collisions ~1012 K ~109 K Neutron Star Thermonuclear Explosion (Terrestrial Nuclear explosions) ~107 K ~106 K Solar Interior ~ 120 MeV ~6000 K Solar Surface Room Temperature ~ 1/40 eV ~300 K Cosmic Microwave Background ~3 K ~10-6 K Rhodium metal spin cooling (2000) ~10-10 K (Low-T World Record!) Trapped Ions
Particle Key “Projectile” “Target” Baryons (p,n,,,…) Mesons (,K,,,…) Note the length contraction of the nuclei along the direction of motion! This is because v~c Nuclear Collisions in Action
“AA” is used to evoke the image of “Atomic Number” …and by colliding nuclei, the bulk properties of nuclear matter can be studied under extreme conditions... “material science” This is akin to colliding blocks of ice to study the phase diagram of water! Density of the system compared to normal nuclear density (0.13/fm3) High energy pp collisions tend to be somewhere in here Collisions fling normal nuclear matter into exotic states Why study proton-proton and nucleus-nucleus collisions at all? Proton-proton (pp) collisions are the simplest case of nucleus-nucleus (AA) collisions... pp collisions form the “baseline” for AA collisions
But why is that? Let’s look at two situations While AA collisions probe the material science of nuclear matter (phase diagrams, etc.) pp collisions more directly probe hadronization Why collide protons at all? The Relativistic Heavy Ion Collider (RHIC) on Long Island, NY slams gold nuclei head-on at 0.99995c, creating “little Big Bangs”!
Lots of stuff happens between when the hadrons are formed and when they fly off to be detected Hadronization 1. Space-Time Evolution of High Energy Nucleus-Nucleus Collision t N K Thermal Freeze-out Hadron Gas Mixed Phase Projectile Fragmentation Region QGP Quark Formation & creation ~ 1fm/c z P T
N K Measuring the extent of this “space-time surface of hadronization” is what is meant by the “size of the collision” Because the system size is so small, there are very few interactions from the moment of impact to when particles are free-streaming towards the detector Hadronization 2. Space-Time Evolution of proton-proton Collision t That’s why pp collisions are a cleaner probe of what is going on during hadronization Quark scattering and creation z P T
Measuring the size of pp collisions gives information about what the collision looked like when the hadrons were created -- this gives us insight into the mysterious process of “hadronization” Ok. But... HOW do you measure the size? Why measure the size of pp collisions? Source sizes are measured using a technique called Hanbury-Brown Twiss Intensity Interferometry (or just HBT for short)
What is HBT? The technique was originally developed by two English astronomers Robert Hanbury-Brown and Richard Twiss (circa 1952) (Sadly, RHB passed away just this January) It’s form of “Intensity Interferometry” -- as opposed to “regular” amplitude-level (Young or Michelson) interferometry -- and was used to measure the angular sizes of stars The method had far reaching consequences! A quantum treatment of HBT generated much controversy and led to a revolution in quantum optics (photons can act strangely!) Later it was used by high energy physicists to measure source sizes of elementary particle or heavy ion collisions But how does HBT work? And why use it instead of “regular” interferometry?
L >> d (brackets indicate time average -- which is what is usually measured) Two slit interference (between coherent sources at A and B) rA1 P1 A Plane wave rB1 d Monochromatic Source B “source geometry” is related to interference pattern
A d B L >> d (brackets again indicate time average) “Two slit interference” (between incoherent sources at A and B) P1 rA1 Two monochromatic but incoherent sources (i.e.with random, time dependent phase) produce no interference pattern at the screen -- assuming we time-average our measurement over many fluctuations rB1
Average of I over a very short time Average of I over a medium time Average of I over a fairly long time For very long time averages we get Long/Short compared to what? The time scale of the random fluctuations What does <I> mean? Position on the screen in radians (for small angles)
P1 rA1 rB1 R rA2 d P2 rB2 L >> (d & R) HBT Example (incoherent sources) A As before... B But if we take the product before time averaging... where (will be related to source and detector geometry) Difference of the path length differences Important: The random phase terms completely dropped out and left us with a non-constant expression!
Time average of the product This quantity is known as a correlation function Product of the time averages It is important to note that for coherent sources (remembering in that case <I>=I) so C=1
If I1 and I2 tend to increase together beyond their averages over the fluctuation times... This gives a big correlation A plot of I1*I2 with the I’s treated as variables If I1 and I2 both tend to stick around their individual averages over the fluctuation times… the correlation tends towards one If either I1 or I2 (or both) tend to be below their averages or are near zero over the fluctuation times… the correlation tends towards zero What does C mean? If we independently monitor the intensity as a function of time at two points on the screen... <I2> I1 <I1> I2 It’s not exactly the usual “statistical correlation function”… but it is related
Two interesting limits (with a “little” algebra)... If d>>R (like an astronomy experiment): If R>>d (like an elementary particle experiment): ˆ ˆ D - D - k ( r r ) ~ kd k k 1 2 1 2 For two incoherent point sources…. Recall The momentum difference is called:
Increasing angular size Increasing source size d Notice that the “widths” of these correlation functions are inversely related to the source geometry source Width w A source can also be a continuous distribution rather than just points The width of the correlation function will have a similar inverse relation to the source size Width ~1/w Correlation function Astronomy For fixed k Particle physics I’ll drop
The HBT effect at the quantum level is deeply related to what kind of particle we are working with Bosons and Fermions Bosons are integer spin particles. Identical Bosons have a symmetric two particle wave function -- any number may occupy a given quantum state... Photons and pions are examples of Bosons Fermions are half-integer spin particles. Identical Fermions have an antisymmetric wave function -- only one particle may occupy a quantum state Protons and electrons are examples of Fermions
At the quantum level: Joint probability of measuring a particle at both detectors 1 and 2 Probability of measurement at 1 times probability of a measurement at 2 The correlation function for Gaussian source distributions can be parameterized like: C Thermal Bosons 2 Partly coherent bosons+contamination Chaoticity parameter Coherent sources (like lasers) are flat for all Q ~ 1/R 1 Q=|p1-p2| Momentum difference Fermions exhibit anticorrelation Fermions 0 More about Correlation functions Than is probably healthy A series of independent events should give C=1 (same as a coherent source) At the quantum level a non-constant C(Q) arises because of I) the symmetry of the two-particle wave function for identical bosons or fermions and II) the kind of “statistics” particles of a particular type obey
HBT Summary and Observations • The correlation function contains information about the source geometry • The width of the correlation function goes like 1/(source width) • The HBT correlation function is insensitive to random phases that would normally destroy “regular” interference patterns
Back to pp Collisions • Pions (also bosons) are used in the HBT rather than photons • Basic idea is the same: Correlation function contains information about pion emission source size in the collision and may give clues about the nature of hadronization
(preliminary analysis this year by TG) I may be a theorist sort but what can I say…real data is fun! Gaussian fit is only so-so for low Q 1/R=0.365 GeV R~2.74 GeV-1~ 0.55fm lam=0.358 Q GeV Real Data! 500k pp events from Experiment NA49 at CERN 1. signal 1. Generate a cumulative signal histogram by taking the momentum difference Q between all combinations of pion pairs in one pp event; repeat this for all pp events 2. Generate a random background histogram by taking the momentum difference Q between pions pairs in different events 3. Generate a correlation function by taking the ratio of signal/random Q GeV 2. random Q GeV 3. correlation Q GeV
NA44 at CERN NPA610 240 (96) R really increases with system size! Just for comparison... C(Q) C is narrower so R is bigger Typical AA Data This isn’t my analysis Q (MeV/c) From Craig Ogilvie (2 Dec 1998)
My current research related to this work • Analysis: HBT for pp collisions at NA49 (at CERN) and STAR (at RHIC) • Evaluate phase space density of the pp system, extract temperature! • Current pure theory project (mostly unrelated to particle physics): What are theoretical correlation functions for parastatistical particles and anyons? • Lots of room for student involvement at various levels!
I guess we expected this :) Lots more interesting work to be done! More reading for the interested viewer... Boffin: A Personal Story of the Early Days of Radar, Radio Astronomy, and Quantum Optics R. Hanbury Brown Intensity Interferometry R. Hanbury-Brown Quantum Optics Scully and Zubairy Quantum Theory of Light Loudon Two-Particle Correlations in Relativistic Heavy Ion Collisions Heinz and Jacak, nucl-th/9902020 What have we learned? HBT can be subtle and fun Quark hadronization is complicated but studying the size of proton-proton collisions using HBT may be able to tell us something about it pp collisions are smaller than AA collisions!