Download
1 / 56
560 likes | 567 Views
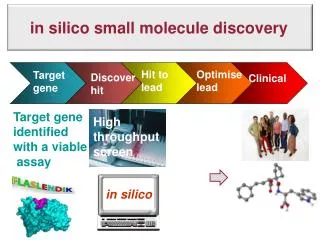
In Silico Identification of Promoters in Prokaryotic Genomes. Manju Bansal Molecular Biophysics Unit Indian Institute of Science Bangalore mb@mbu.iisc.ernet.in. Indo-Russia Workshop Novosibirsk 12-14 Oct 2008. How does RNA polymerase know where to start transcription?.

E N D
In Silico Identification of Promoters in Prokaryotic Genomes Manju Bansal Molecular Biophysics Unit Indian Institute of Science Bangalore mb@mbu.iisc.ernet.in Indo-Russia Workshop Novosibirsk 12-14 Oct 2008
How does RNA polymerase know where to start transcription? It is through sequence motifs which match the consensus sequences in -10 and -35 regions, but large variability seen. Also similar sequences seen in non-promoter regions.
TSS -35 -10 17 bp 1 SPACER Consensus araBAD araC galP1 TTGACA CTGACG TGGACT GTCACA TATAAT TACTGT GACACT TATGGT Some typical promoter sequence motifs • There are few sequence motifs which exactly match the consensus sequence, large variability seen. • Similar sequences seen in non-promoter regions.
Because: The sequence motifs are only 6-10 bp long and are degenerate, the probability of finding similar sequences in regions other than promoters is quite high. • E. coli genome size: 4,639,221 bp • E. coli DNA has ~1400 annotated promoter sites in Ecocyc database but ~4500 annotated genes • Number of ‘-10 consensus’ hexamer sequences expected in E. coli : 1058 (with exact match viz no mismatch/changes from consensus) 35,762 (1 mismatch), 3,26,746 (with 2 mismatches) e.g.: consensus TATAAT vs TATGGT OR E. coli should have a ‘-10 like’ sequence at every 4400 nt (exact match), or every 130th nt (with 1 mismatch) or 14th nt (with 2 mismatches)
Does this indicate that there are other signals which help in positioning RNA polymerase? Hence analysis of structural properties of a DNA sequence to locate signals that are: • Relevant to transcription from a functional/mechanistic/structural point of view. • Unique to the promoter sequences and can be used to differentiate between promoter and non-promoters. • Can be predicted from a given sequence. For example: 1) DNA STABILITY (Ability of DNA to Open up) 2) DNA CURVATURE (Intrinsically curved DNA structure) 3) DNA BENDABILITY (Ability of DNA to bend)
Why Stability? • An important step in transcription is the formation of an open complex which involves strand separation of DNA duplex upstream of the transcription start site (TSS) • This separation takes place without the help of any • external energy. • Hence evaluating stabilities of promoter sequences may give some clues.
Stability of base paired dinucleotides based on Tm (melting temp data) on a collection of 108 oligonucleotide duplexes. SantaLucia J (1998) Proc. Natl. Acad. Sci. USA 95(4):1460-1465.
A representative free energy profile for 1000nt long E. coli promoter sequence
Verteb: 252 Plants: 74 E coli: 227 B Subtilis: 89 Kanhere and Bansal, Nucl. Acid Res. (2005) 33, 3165-3175
Roll at junction Roll at every step
Dinucleotide parameters Bansal M (1996)Biological Structure and Dynamics, Proceedings of the Ninth Conversation (Vol. I) pp 121-134
A representative intrinsic curvature profile for 1000nt long E. coli promoter sequence
Kanhere and Bansal, Nucleic Acid Research (2005) 33, 3165-3175
DNA bendability DNA Protein
Distribution of different signals in272 E. coli promoters 10% seqs show no signals 90% show atleast one signal 24% 19% 3% 4% 2%
Hence: • The upstream region and downstream regions, with respect to the TSS, show considerable differences in their properties. • Upstream region is less stable, more rigid and more curved compared to the downstream region, in prokaryotic and eukaryotic genomes. • Stability signal is much more common than other two signals • Some of the promoters which do not show any of the three signals are either internal/secondary/weak promoters
Can incorporating these features help in • improving the promoter prediction tools? • Since low stability signature was found to be most • common in promoters – it was examined first. • E. Coli promoter data was studied in detail, also • B. Subtilis and M. tuberculosis as examples.
Average stability profile for 429 E. coli promoters (from EcoCyc Database V 9.1), located atleast 500 nt apart
Nucleotide composition (in %) for three bacterial systems. Difference between Mtb and others is clearly seen The composition was calculated for 101 nt length (ranges from -200 to -100, 100 to 200 and -80 to +20 with respect to TSS) promoter sequences. 582 promoter sequences from E. coli, 305 promoter sequences from B.subtilis and 42 promoter sequences from M. tuberculosis were obtained when the TSS are 200 nt apart.
Average stability profile for promoter sequences that are 500 nt apart A) 429 E. coli promoters (from EcoCyc Database V 9.1) B) 239 B. subtilis promoters (from DBTBS Database) C) 40 M. tuberculosis promoters (from MtbRegList Database) One sharp peak corresponding to high A+T content seen
Sensitivity and precision for promoter prediction of 500 nt apart experimentally verified bacterial TSS. False negatives after first cycle are taken for the second cycle promoter prediction, with E1 window size of 50nt. False negatives remaining after second cycle are considered for sensitivity calculation. True positives and false positives are added up after first and second cycle prediction. Definition of TP, FP: V Rangannan and M Bansal, J. Biosci. 32, 851-862 (2007).
Av stability profile for all 4461 genes in E. Coli aligned w.r.t their TLS Average stability profile for 4461 E. coli gene sequences of 1001nt length (-500 to +500 w.r.t TLS) Nos of nucleotides between each TSS (#729) and TLS (considering the occurrence of the first gene). Min dist = 0, Max dist = 708
E. Coli – Average stability profile for 1089 Protein promoter sequences and 59 RNA promoter sequences E. Coli – Average stability profile for 34 tRNA promoter sequences and 13 other RNA promoter sequences
Whole genome annotation for promoter regions in E coli and B. subtilis • a 3 TSSs of E. coli and 1 TSS of B. subtilis regulate protein as well as RNA genes. • b True and false positives are identified against the genes in forward and reverse strand. • c True positive is calculated with respect to the annotated TSS (located in -150 to +50 nt region w.r.t TSS) • 63% and 68% accuracy (precision) achieved in case of E. coli and B. subtilis respectively w.r.t TLS • 75% and 59% reliability achieved in case of E. coli and B. subtilis respectively w.r.t annotated TSS (against 37% in case of SIDD for 927 TSS in E. coli).
Whole genome annotation of promoter regions over M. tuberculosis genome
All false positives need not be REAL false positives • In prokaryotic genomes, the intergenic region is very small (~ 12%). • Experimental evidence shows that for some genes the regulating transcription start site lies within the coding region of an upstream neighboring gene. • For example, the E.coli rpoS gene has its transcribing TSS (rpoSp) within the coding region of nlpD gene and 567 nt away from its own TLS. Lange R, Fischer D and Hengge-Aronis R., J Bacteriol. (1995); 177(16):4676-80
Distribution of coding and intergenic regions in the bacterial genomes • Histograms showing the distribution of predicted promoter regions in different genomic regions in E. coli, B. subtilis and M. tuberculosis genomes. Color coding for intergenic and coding region are shown on top right.
Predicted promoter region distribution in E. coli genome (over ALL 1145 Ecocyc annotated, 1001 nt long promoter sequences).
Comparison of our method of promoter prediction with NNPP, w.r.t TLSS at position 0
Average energy profile for E.coli genomic fragment 9000bp to 15300bp
Average energy profile for E.coli genomic fragment 3483400bp to 3487000bp (DIV intergenic region)
Average energy profile for E.coli genomic fragment 2863000bp to 2867600bp (CON intergenic region)
Conclusions • Relative stability of DNA in neighboring regions can help in annotating for promoter regions in whole genomes • The method is quite general and shown to work for genomes with varying AT/GC content. • The stability criteria performs better than other commonly used methods based on sequence motif search as well as the superhelix induced destabilization in DNA (SIDD) method.
No of promoter sequences grouped according to their %GC content in the three bacterial systems • TSSs which are 500nt apart are considered in E. coli, B. subtilis and M. tuberculosis. • GC categorization is done based on the %GC over 1001nt long promoter sequences (ranging from -500 to +500 w.r.t TSS).
Average free energy distribution over promoter sequences with diverse GC composition • -500 to +500 region with respect to TSS (B) -80 to +20 region with respect to TSS • The average free energies over the promoter regions with similar GC composition are approximately samewith E. coli and B.subtilis nearly overlapping for %GC intervals 35-40%, 40-45%, and 45-50% , in case of 1001 nt long promoter regions.
Thresholds of free energy values used to predict promoters in genomic DNA with varying GC content E is the average free energy over the -80 to +20 region of known promoters, and D is the difference between E and the average free energy over random sequences generated from downstream (+100 to +500 region) genomic sequence (REav).
Stability characteristics of TF binding site (e.g. CRP) Region of high stability corresponds to a binding site for CRP in E coli. The high stability trough extends for ~22 nucleotides (window size = 15 nts), which is the same as the foot print size of the protein reported in literature.
NNNNNNNNNNNNNTGTGANNNNNNACACANNNNNNNNNNNNN 5’ flanking region 6-nt linker 3’ flanking region CRP: Average stability profile for manipulated sequences
TGTGANNNNNNACACA CRP: Average bendability profile
Acknowledgements: Dr Dhananjay Bhattacharyya Dr Aditi Kanhere Ms Vetriselvi R Mr Vikas Sarma Mr Nishad Matange Financial Support: Dept of Biotechnology, India Thank You
Coding and inter-genic region distribution in E. coli and B. subtilis genome. Histograms show the distribution of predicted promoter regions in different intergenic regions in E.coli and B.subtilis genomes (as per the color coding in the legend).