Download
1 / 17
170 likes | 266 Views
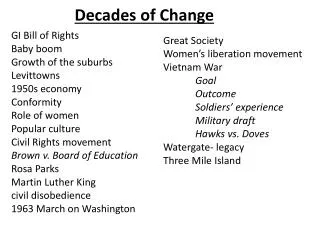
A Few Decades of Change in Milk Production. Mark Stephenson, Ph.D. Director of Dairy Policy Analysis. A Tale of Three States. Millions of Pounds of Milk. Retail Consolidation. Major retailers consolidating Kroger Albertsons Safeway Ahold Walmart factor, club stores

E N D
A Few Decades of Change in Milk Production Mark Stephenson, Ph.D. Director of Dairy Policy Analysis
A Tale of Three States Millions of Pounds of Milk
Retail Consolidation • Major retailers consolidating • Kroger • Albertsons • Safeway • Ahold • Walmart factor, club stores • Large food service buyers • Fewer buyers force change on suppliers
Cooperatives • Top 10 -1994 • AMPI (15.7) B. lbs.) • Mid-America (8.9) • Cal Milk Prod (6.1) • Farmers Union (5.5) • Dairygold (5.0) • Land ‘O Lakes (4.0) • MMI (3.8) • Dairymen Inc (3.6) • Atlantic (3.6) • DCCA (3.5) • Top 50 -- 111 B lbs • Top 10 -2012 • DFA (39 B. lbs.) • Cal. Dairies (16.8) • Land ‘O Lakes (13) • Northwest Dairy (7.9) • Dairylea (6.3) • Family Dairies (5.9) • AMPI (5.8) • Foremost (5.7) • Manitowac (5.1) • Select (4.2) • Top 50 -- 154 B lbs.
Milk per cow • Milk per cow has grown 281 lbs per cow per year—roughly 2% per year. • About half of yield efficiencies is attributable to genetic gains and half to management • Population growth has been roughly 1% per year. • Yield growth has outpaced demand • Implies fewer cows are needed
Cow Loss • Most farms have not reduced cow numbers • Indeed, new technologies, like the bulk tank, artificial insemination, TMRs and rBST have encouraged farms to explore returns to scale. • We have been losing farms to adapt to increased efficiencies
Different Business Models “Traditional” Dairy Farm “Western-Style” Dairy Farm Own enough land to store feed and house and milk cows. Larger average number of cows per farm. Somewhat smaller average milk price. Higher variable costs—lower fixed costs of production. • Own enough land to grow forages house and milk cows and spread manure. • Smaller average number of cows per farm. • Somewhat larger average milk price. • Lower variable costs—higher fixed costs of production.
Three Kinds of Growth • Stable cows but increases in milk per cow • Moderate, maybe lumpy, growth in cow numbers on existing farms • Explosive growth with new dairy operations