Download
1 / 9
90 likes | 254 Views
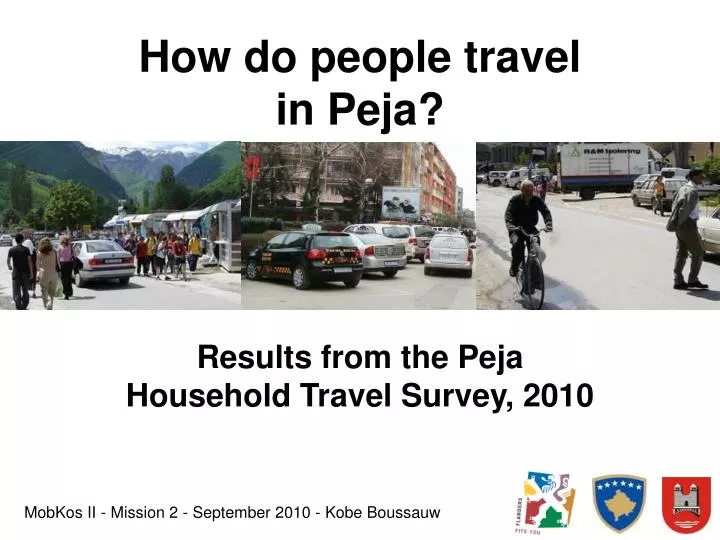
How do people travel in Peja?. Results from the Peja Household Travel Survey, 2010. MobKos II - Mission 2 - September 2010 - Kobe Boussauw. 1. Household composition. on average 5,2 family members: 1,4 are working 1,6 go to school. 2. Vehicle ownership. 22% of households do not own a car

E N D
How do people travel in Peja? Results from the PejaHousehold Travel Survey, 2010 MobKos II - Mission 2 - September 2010 - Kobe Boussauw
1. Household composition • on average 5,2 family members: • 1,4 are working • 1,6 go to school
2. Vehicle ownership • 22% of households do not own a car • 0,93 cars per family (high) => 0,18 cars per individual (low) • cars are quite old (14 years) • very little bicycles are avaible: 59% of families do not have a bike, while only 10% has more than one
3. Home-to-work travel • average distance is 3,9 km (very short) and 95% lives less than 10 km away • only 2% is employed outside Peja regio, 1% in Pristina • average travel time is 16 min (quite short) • 60% walks, 6% by bike, 30% by car
4. Home-to-school travel • average distance is 4,8 km (quite short) and 95% lives less than 5 km away • 4% is studying outside Peja regio, mostly in Pristina • average travel time is 21 min (quite normal) • 92% walks, 6% by bus
5. School travel: school survey • the school survey by the ngo “Safe Trip” shows slightly different results, since also children from outside the city are included • survey covers almost 7000 primary school pupils • 85% walks, 10% by car, 3% by bus and 3% by bike
6. Relationships between mode and distance: work travel • in short distance classes, shorter trips are linked to walking and longer trips are linked to driving • in long distance classes, longer trips are also associated with use of the bus
7. Relationships between mode and distance: school travel • in short distance classes, shorter trips are strongly linked to walking (longer trips are linked to car use, but weaker relationship) • in long distance classes, longer trips are strongly associated with use of the bus
8. Conclusion and policy implications • short internal distances in the city are important • so the amount of cars can be limited in the future • thus, compact and mixed urban development is important • BUT: • the city is expanding anyway • so, cycling should be encouraged and urban public transport should be introduced to reduce car dependence