Download
1 / 13
130 likes | 247 Views
Rob Ord, PhD, LLB. HUMAN CARRYING CAPACITIES: a new economics. “I made a mistake in presuming that the self-interest of organizations, specifically banks and others, was such that they were best capable of protecting their own shareholders and their equity in the firms”.

E N D
Rob Ord, PhD, LLB HUMAN CARRYING CAPACITIES: a new economics “I made a mistake in presuming that the self-interest of organizations, specifically banks and others, was such that they were best capable of protecting their own shareholders and their equity in the firms”. (former chairman of the Federal Reserve Alan Greenspan , October 2008)
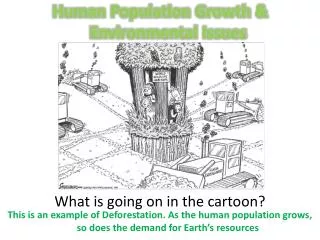
A ‘big picture’ economic model based on limited resources: • would treat human economic ‘growth’ like any other biological growth curve (i.e. Fig 1); • would see ‘redundancies’ for what they are – literally humans ‘excess to capacity’; • would predict when debt could not be repaid because resources are no longer available; • would take account of humans’ highly evolved “social contracts”; • would involve multi-perspective thinking based on legal (Hart) and biological (K) fundamentals : * from the bottom-up as when weighing ‘human resources’ against automation. * from the top-down as with the reduced vulnerability of a country rich in non-renewable resources versus one which cannot supply its population with a basic need.
Long term recoveryOrd, 2006 • The predicted result of 100 years of 1-child families on a per generation basis, assuming all are reproducing adults and exclusive of lag effects is as follows: __________________________________________________ 25 y 50 y 75 y 100 y 8 Billion → 4 Billion → 2 Billion → 1 Billion → 0.5 Billion 20102035 2060 2085 2110 __________________________________________________ • Even 2 billion humans may no longer present a significant threat to global weather, ecology, or supply, given technology & environmental awareness.
CONCLUSION • Resource depletion and pollution threaten the global carrying capacity K. The global economic debacle is proposed to be an early warning that population is in excess of K. • Realistic models that internalise physical, biological, and social parameters are needed to establish a new economic paradigm. • States other than China and India need to ‘depopulate, automate and conserve’.
Thesis • Debt is postponed poverty, which if unpayed leads to demographic entrapment and pressure on K. • Population growth in humans is density dependent, with regional 'K' s. • It is proposed that current trends in food, water, energy, land, the housing crisis and associated debt are harbingers that in the United States 'K' will decline. • A new US 'K' based on remaining unpolluted resources is likely to be lower than 300 M. • In the United States population reduction to 'K' can be voluntary or involuntary. • Other countries may not have such a choice.
'TOTAL CAPABLE COUPLES' • The situation is not so simple when lag effects* are estimated, but the reduction is still profound. According to the cited source, 7% are too old and 27% too young to have children. Furthermore an aging population is likely to assume a higher death rate**. __________________________________________________ 60 years 140 years 3.5 Billion →→ 2 Billion →→→ 1 Billion 2010 2070 2150 __________________________________________________ * Global average deaths set at 10/1000 rather than 9/1000; 66% of ‘couples’ are assumed to have 1 child over a 30 year period ** Currently, death rate is 63 million people per year (global average 9/1000; births are 21/1000; fertility rate is 2.7; population is estimated at 6.55 billion but is assumed to be 7 billion at 2010; source US Population Reference Bureau • If single child families started in 2010 and the death rate remained constant, population would start to decrease immediately.
Verhulst Logistic Growth dN/dt = rN [(K - N)/K] Nt = K / (1 + b e-rt) b = (K - No )/ No ln b = t'/r
http://www.cnr.berkeley.edu/biocon/BC%20Class%20Notes/67-72%20Factors%20Growth.pdfhttp://www.cnr.berkeley.edu/biocon/BC%20Class%20Notes/67-72%20Factors%20Growth.pdf Source: Lectures from Centre for Biological Control, UC Berkeley
'Populus' Graphics [1]Alstad, D, Anderson A, Roe L, Noorbaloochi, S and C Bratteli, “Populus: Simulations of Population Biology” (U. Minnesota Dept. of Ecology, Evolution and Behavior.