Download
1 / 27
270 likes | 273 Views
Learn about the prediction and simulation of mass spectra in chemistry and biology. Discover the history of artificial intelligence and mass spectrometry, as well as the methods and algorithms used in predicting and simulating mass spectra. Explore case studies and working examples in this informative course.

E N D
Chemistry Biology Welcome! Mass Spectrometry meets Cheminformatics WCMC Metabolomics Course 2013 Tobias Kind Course 7: Prediction and simulation of mass spectra Informatics http://fiehnlab.ucdavis.edu/staff/kind CC-BY License
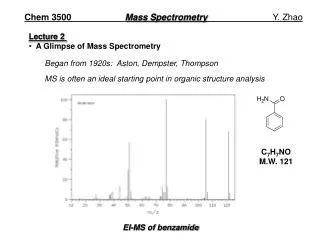
History of artificial intelligence and mass spectrometry Dendral project at Stanford University (USA) Started in 1960s Pioneered approaches in artificial intelligence (AI) Aim: Prediction of isomer structures from mass spectra Idea: Self-learning or intelligent algorithm Participants: Lederberg, Sutherland, Buchanan, Feigenbaum, Duffield, Djerassi, Smith, Rindfleisch, many others… Status: Failed; but inspirational until today (50 years later) Figure: Heuristic DENDRAL: A Program for Generating Explanatory Hypotheses in Organic Chemistry Overview: DENDRAL: a case study of the first expert system for scientific hypothesis formation; Artificial Intelligence 61 (1993) 209-261 [Dendral PDF]
Prediction and simulation of mass spectra • Prediction of the isomer structure or substructures from a given mass spectrum • The structure is directly deduced from the mass spectrum or generated by • a molecular isomer generator or existing structures can be found in a structure database B) Simulation of a mass spectrum from a given isomer structure The mass spectral peaks and abundances are generated by a machine learning algorithm The structures can be obtained from a isomer database (PubChem, LipidMaps) or a sequence database (Swiss-Prot, NCBI) in case of proteins
Prediction of substructures from mass spectra Working examples for EI mass spectra: Varmuza classifiers in AMDIS and MOLGEN-MS Substructure algorithm (Stein S.E.) Implemented in NIST-MS search program Mass spectral classifiers for supporting systematic structure elucidation Varmuza K., Werther W., J. Chem. Inf. Comput. Sci., 36, 323-333 (1996). Chemical Substructure Identification by Mass Spectral Library Searching S.E. Stein, J. Am. Soc. Mass Spectrom., 1995, 6, (644-655) Picture source: amdis.net
Substructures deduced from mass spectra for generation of isomer structures • Molecular formula must be known - can be detected from molecular ion and isotopic pattern • Good-list (substructure exists) and bad-list (substructure not existent) approach • Sub-structures are combined in deterministic or stochastic (random) manner • Database or molecular isomer generator (combinatorial, graph theory) approach for generating or finding possible structure candidates Database (Chemspider): 25 hits (including all possible existing structures) MOLGEN Demo: All constructed isomers: 8372 Example: Molecular formula C6ClH5O; calculated from molecular ion -benzene -hydroxy -chlorine Goodlist: Badlist: Total: 3 possible results Picture source: amdis.net
Aristo – ontology classification of EI mass spectra http://www.ionspectra.org/aristo/
Application: Decision tree supported substructure prediction of metabolites from GC-MS profiles Spectrum Decision tree Compound structure http://gmd.mpimp-golm.mpg.de/ Source: Metabolomics. 2010 Jun;6(2):322-333. Epub 2010 Feb 16. Decision tree supported substructure prediction of metabolites from GC-MS profiles. Hummel J, Strehmel N, Selbig J, Walther D, Kopka J.
METFRAG: In silico fragmentation for mass spectral identification Submit: mass spectral information. Result: Ranked hit list of molecules http://msbi.ipb-halle.de/MetFrag/
Simulation of mass spectra Why is simulation of mass spectral fragmentation important? Imagine – you have a structure database of all molecules Imagine – you can simulate mass spectra for all these molecules Imagine – you can match your experimental spectra against a database of calculated spectra (*) Heuristic or de-novoalgorithm to generate MS or MS/MS spectra Isomer DB MS DB of theoretical spectra (*) Theoretical spectrum is depiction only, not truly simulated.
General methods for simulation of mass spectra Ab-initio or de-novo first principle methods QCEIMS EI-MS Superior, because they solve the problem at the root;Slower to implement CID-MS Heuristics or rule based algorithms LipidBlast CID-MS/MS Solve practical problems; Faster to implement Approach Domain Example QCEIMS: Towards first principles calculation of electron impact mass spectra of molecules.; Grimme S.; Angew Chem Int Ed Engl. 2013 Jun 10;52(24):6306-12. doi: 10.1002/anie.201300158; LipidBlast: LipidBlast in silico tandem mass spectrometry database for lipid identification. Kind T, Liu KH, Lee do Y, Defelice B, Meissen JK, Fiehn O. Nature Methods. 2013 Aug;10(8):755-8. doi: 10.1038/nmeth.2551.
Simulation of alkane mass spectra (I) Approach Use of artificial neural networks (ANN) (machine learning) Electron impact spectra 70 eV Substructure descriptors were used for calculation Selection of 44 m/z positions – training was performed for correct intensity 117 noncyclic alkanes and 145 noncyclic alkenes training set: 236 molecules prediction set: 26 compounds Problems Prediction or validation set very small (should be 30%) Prediction of molecular ion (usually very low abundant) Overfitting possible, works only for selected substance classes Source: WIKI Source: Jalali-Heravi M. and Fatemi M. H.; Simulation of mass spectra of noncyclic alkanes and alkenes using artificial neural network
Simulation of alkane mass spectra (II) 2,3,3-trimethylpentane (a and b) and 2,3,4-trimethylpentane (c and d). OKVWYBALHQFVFP-UHFFFAOYATRLPGDEORIPLBNF-UHFFFAOYAR Source: Jalali-Heravi M. and Fatemi M. H.; Simulation of mass spectra of noncyclic alkanes and alkenes using artificial neural network Analytica Chimica Acta; Elsevier permission use for coursepack/classroom material Structures: Chemspider
Simulation or prediction of oligosaccharide spectra (carbohydrate sequencing) Consistent building blocks (sugars) Consistent fragmentation allows in-silico fragment prediction Pre-calculated fragments from known structures can be stored in database (use NIST-MS-Search) Algorithm works also on-the-fly without database De-novo algorithms work for truly unknown structures See Oscar and FragLib See GlySpy Source: Congruent Strategies for Carbohydrate Sequencing. 3. OSCAR: An Algorithm for Assigning Oligosaccharide Topology from MSn Data http://www.pubmedcentral.nih.gov/articlerender.fcgi?artid=1435829
Simulation of peptide fragmentations (De-novo sequencing of peptides) Principle: De-novo sequencing of peptides (determine amino acid sequences) De-novo algorithms can perform permutations and combinatorial calculations from all 20 amino acids (superior if the sequence is not found in a database) Highly dependent on good mass accuracy (less than 1 ppm) of precursor ion and MS/MS fragments Generate match score by matching in-silico fragments against experimental MS/MS spectrum Problems: Leucine and isoleucine have same mass Post translational modifications (PMTs) Missing fragment peaks Picture source: MWTWIN help file2 (Monroe/PNNL) Picture 2 source: Tandem mass spectrometry data quality assessment by self-convolution Keng Wah Choo and Wai Mun Tham http://www.biomedcentral.com/1471-2105/8/352
In-silico fragmentation with MassFrontier using fragmentation library of 20,000 mechanisms from literature Result fragmentations are represented as bar code spectra (same abundance)
Simulation of lipid tandem mass spectra (I) Single examples Similar structures; plus CH2 in side chains sn1 and sn2; double bonds possible Similar and almost constant fragmentation rules Loss of head group (diagnostic ion in MS and MS/MS spectrum) Loss of rest one (R1) and rest two (R2) can be observed in MS/MS spectrum Picture: Thanks to Yetukuri et al.BMC Systems Biology 2007 1:12 doi:10.1186/1752-0509-1-12
sn1 = alkyl or acyl rest head group sn2 = alkyl or acyl rest Combinatorial scaffold library design Functional group (variable) Linker Scaffold (conserved) choline C16 C14 inositol C12 C10 glycerol + LipidMaps nomenclature name generation + accurate isotopic fragment calculation + mass spectral peak annotation + heuristic peak abundance modeling (CID voltage dependent) + conversion into mass spectral library format Source: LipidBlast
Simulation of lipid tandem mass spectra (II) Simulation of tandem mass spectra or MS/MS fragment data from LipidMaps Experimental Mass spectrum In-silico prediction of MS/MS mass spectral fragments Spectrum Source:Lipidmaps.org
LipidBlast MS/MS mass spectral modeling Experimental MS/MS precursor m/z = 732.55 [M+H]-sn1 [M+H]-sn2 [M+H]-sn1-H2O [M+H]-H2O (-18) [M+H]-sn2-H2O [M+H]-C5H14NO4P (-183) in-silico MS/MS match precursor m/z = 732.55 [M+H]-C3H9N (-59) • In-silico mass spectra: • m/z fragments and abundance calculation required • statistical (computer derived) and heuristic rules (experience of a human expert) 19
LipidBlast in-silico modeling of lipid tandem mass spectra Covered adduct ions: [M+H]+; [M+Na]+; [M+NH4]+; [M-H]-; [M-2H](2-); [M+NH4-CO]+; [M+Na2-H]+; [M]+; [M-H+Na]+; [M+Li]+ LipidBlast in silico tandem mass spectrometry database for lipid identification. Kind T, Liu KH, Lee do Y, Defelice B, Meissen JK, Fiehn O. Nature Methods. 2013 Aug;10(8):755-8. doi: 10.1038/nmeth.2551.
LipidBlast MS/MS search with NIST MS search program using precursor search and dot-product match can be used by practitioners exp. MS/MS Experimental MS/MS list exp. MS/MS in-silico MS/MS Library hit scores in-silico MS/MS Search speed ~ 100 MS/MS spectra per second (without GUI)
LipidBlast example: ion trap mass spectrometer Source: Agilent.com Experimental Library Agilent Ion Trap SL/XCT Name: PC 34:1; [M+Na]+; GPCho(16:0/18:1(11E)) MW: 782 ID#: 42511 DB: lipidblast-pos Comment: Parent=782.56759 Mz_exact=782.56759 ; PC 34:1; [M+Na]+; GPCho(16:0/18:1(11E)); C42H82NO8P 8 m/z Values and Intensities: 723.49409 999.00 [M+Na]-C3H9N (-59) 599.50155 600.00 [M+Na]-C5H14NO4P (-183) 544.33807 20.00 [M+Na]-sn1 526.32751 20.00 [M+Na]-sn1-H2O 518.32243 20.00 [M+Na]-sn2 500.31187 20.00 [M+Na]-sn2-H2O 467.25401 40.00 [M+Na]-59-sn1 441.23837 40.00 [M+Na]-59-sn2 1st Hit group PC 34:1 (42 candidates) Fatty acyl side chains (sn1, sn2) best detected in negative ionization mode LC/MS Analysis of Bronchoalveolar Lavage Fluid Phospholipids as Biomarkers for Chronic Lung Inflammation; Agilent application note; 5989-1491EN; Barroso, Bischoff
LipidBlast example : Hybrid Ion-Trap (IT) and Time-of-Flight (TOF) Source: schimadzu.com Shimadzu's LCMS-IT-TOF Experimental Library 1st Hit Name: SQDG 34:3; [M-H]-; SQDG(16:0/18:3(6Z,9Z,12Z)) MW: 815 ID#: 106150 DB: lipidblast-neg Comment: Parent=815.49792 Mz_exact=815.49792 ; SQDG 34:3; [M-H]-; SQDG(16:0/18:3(6Z,9Z,12Z)); C43H76O12S 559.25784 300.00 [M-H]-sn1 537.27348 300.00 [M-H]-sn2 277.21662 100.00 sn2 FA 255.23226 100.00 sn1 FA 225.00690 999.00 fragment C6H9O7S SQDG 34:3 (8candidates) Source: A Chloroplastic UDP-Glucose Pyrophosphorylase from Arabidopsis Is the Committed Enzyme for the First Step of Sulfolipid Biosynthesis Y Okazaki, M Shimojima, Y Sawada et al. The Plant Cell 21:892-909 (2009);
LipidBlast example : ion trap mass spectrometer Experimental Library Thermo Finnigan LCQ/LTQ Name: LipidA PP [14/14/14/14/3O-(12)/3O-(14)]; [M-H]-; MW: 1796 ID#: 64304 DB: lipidblast-neg Comment: Parent=1796.21157 Mz_exact=1796.21157 ; LipidA PP [14/14/14/14/3O-(12)/3O-(14)]; [M-H]-; C94H178N2O25P2; LipidA-PP-[R2(14:0)(3-OH)/R3(14:0)(3-OH)/R2'(14:0)/R3('14:0)/R2'-3-O-(12:0)/R3'-3O-(14:0)] 9 largest peaks: 1552.00785 999.00 | 1698.23467 600.00 | 1796.21157 500.00 | 1498.05715 300.00 | 1470.02587 300.00 | 1596.03405 250.00 | 1568.00277 250.00 | 1454.03095 250.00 | 1714.22959 50.00 | 9 m/z Values and Intensities: 1796.21157 500.00 [M-H]- 1714.22959 50.00 [M-H]-PO3H 1698.23467 600.00 [M-H]-PO4H3 1596.03405 250.00 [M-H]-PO4H3-R2'-O-FA 1568.00277 250.00 [M-H]-PO4H3-R3'-O-FA 1552.00785 999.00 [M-H]-R2 acyl FA || [M-H]-R3 acyl FA 1498.05715 300.00 [M-H]-PO4H3-R2'-O-FA 1470.02587 300.00 [M-H]-PO4H3-R3'-O-FA 1454.03095 250.00 [M-H]-R2-PO4H3 || [M-H]-R3-PO4H3 2nd Hit Lipid A (PP) (16 candidates) Structural analysis of lipid A from Escherichia coli O157:H7:K- using thin-layer chromatography and ion-trap mass spectrometry; Chang-Soo Lee, Yun-Gon Kim, Hwang-Soo Joo, Byung-Gee Kim; J Mass Spectrom. 2004 May;39(5):514-25.
LipidBlast example : hybrid quadrupole ion mobility spectrometry time-of-flight Source: Waters.com Waters HDMS Synapt Experimental Library Name: PC 32:0; [M+Na]+; GPCho(16:0/16:0) MW: 756 ID#: 42167 DB: lipidblast-pos Comment: Parent=756.55190 Mz_exact=756.55190 ; PC 32:0; [M+Na]+; GPCho(16:0/16:0); C40H80NO8P 5 m/z Values and Intensities: 697.47840 999.00 [M+Na]-C3H9N (-59) 573.48586 600.00 [M+Na]-C5H14NO4P (-183) 518.32238 20.00 [M+Na]-sn1 || [M+Na]-sn2 500.31182 20.00 [M+Na]-sn1-H2O || [M+Na]-sn2-H2O 441.23832 40.00 [M+Na]-59-sn1 || [M+Na]-59-sn2 1st Hit PC 32:0 Source: Direct Tissue Imaging and Characterization of Phospholipids Using MALDI SYNAPT HDMS System; Waters 2008; 720002444en Emmanuelle Claude, Marten Snel, Therese McKenna, James Langridge;
The Last Page - What is important to remember: • Fragmentation and rearrangement rules and ion physics can be programmed into algorithms • Abundance calculations are problematic • Prediction of isomer substructures from mass spectra is possible • Works for reproducible mass spectra • A simplified simulation of mass spectra and simulation of fragmentation pattern • is only possible for certain molecule classes • Works only for peptides, lipids, oligosaccharides, alkanes • Does not work for all other molecules • Does not work with complex (side chain) modifications • Validation, Validation, Validation. Proof must be given that algorithm works for large diverse sets of molecules (n=100..100,000)
Literature (236 min): Mathematical tools in analytical mass spectrometry [DOI] Metabolomics, modelling and machine learning in systems biology – towards an understanding of the languages of cells [DOI] Heuristic DENDRAL: A Program for Generating Explanatory Hypotheses in Organic Chemistry [PDF] Mass Analysis Peptide Sequence Prediction [LINK] GlySpy and the Oligosaccharide Subtree Constraint Algorithm (OSCAR) Mass Frontier for further discussion MOLGEN-MS [LINK] http://fiehnlab.ucdavis.edu/staff/kind/Metabolomics/Structure_Elucidation/ http://fiehnlab.ucdavis.edu/projects/LipidBlast MetIDB: A Publicly Accessible Database of Predicted and Experimental 1H NMR Spectra of Flavonoids [LINK] METFRAG: In silico fragmentation for computer assisted identification of metabolite mass spectra [LINK] Advances in structure elucidation of small molecules using mass spectrometry [Link] Computational mass spectrometry for small molecules [Link]