Download

1 / 14
140 likes | 161 Views
Novel Transition metal complexes of an organylborate ligand, hydrobis (benzoato)<br>(salicylylaldehyde) borate have been synthesized as its potassium salt (KL), the treatment of KL<br>with one equivalent of MCl2.6H2O gave complexes [ML(H2O)x.Cl] (X= 2, M= Co(II), Ni(II)) and<br>one equivalent of CuCl2.2H2O gave [CuLCl] complex. All compounds were characterized by<br>elemental analyses, FTIR, 1H NMR, ESI MS, UV-Vis spectroscopic techniques, thermal analyses,<br>conductivity and magnetic data measurements. On the basis of these studies, a six coordinate<br>octahedral geometry around the Co(II), Ni(II) ions in the complexes and a four coordinate<br>square planner around Cu(II) complex has been proposed. Antifungal and antibacterial studies<br>were carried out by performing Minimum Inhibitory Concentration (MIC80), Disc diffusion assay<br>and WST1 cell cytotoxicity assay. The result showed that the test compounds possess potent<br>anticandidial and antibacterial activities, when treated against different pathogenic fungi and<br>bacteria. <br>

E N D
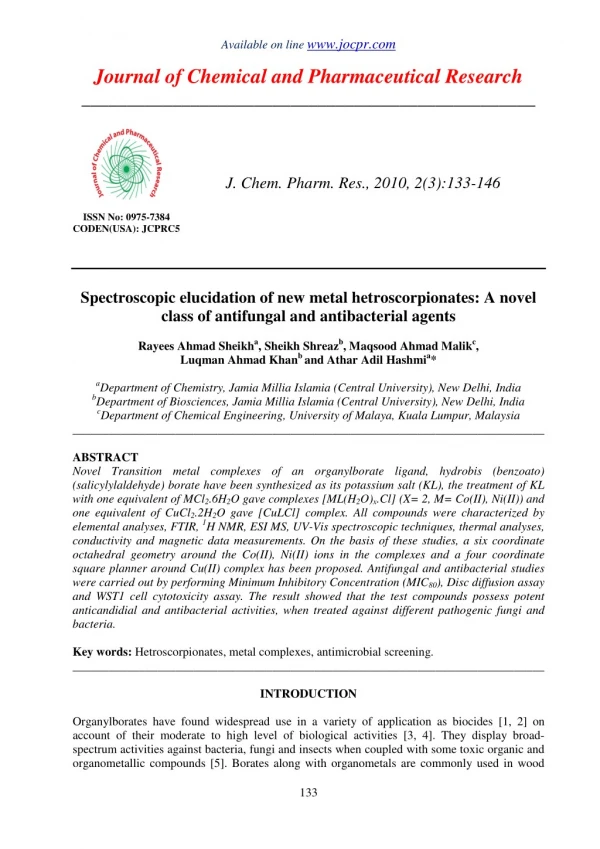
Available on line www.jocpr.com Journal of Chemical and Pharmaceutical Research __________________________________________________ J. Chem. Pharm. Res., 2010, 2(3):133-146 ISSN No: 0975-7384 CODEN(USA): JCPRC5 Spectroscopic elucidation of new metal hetroscorpionates: A novel class of antifungal and antibacterial agents Rayees Ahmad Sheikha, Sheikh Shreazb, Maqsood Ahmad Malikc, Luqman Ahmad Khanb and Athar Adil Hashmia* aDepartment of Chemistry, Jamia Millia Islamia (Central University), New Delhi, India bDepartment of Biosciences, Jamia Millia Islamia (Central University), New Delhi, India cDepartment of Chemical Engineering, University of Malaya, Kuala Lumpur, Malaysia ______________________________________________________________________________ ABSTRACT Novel Transition metal complexes of an organylborate ligand, hydrobis (benzoato) (salicylylaldehyde) borate have been synthesizedas its potassium salt (KL), the treatment of KL with one equivalent of MCl2.6H2O gave complexes [ML(H2O)x.Cl] (X= 2, M= Co(II), Ni(II)) and one equivalent of CuCl2.2H2O gave [CuLCl] complex. All compounds were characterized by elemental analyses, FTIR, 1H NMR, ESI MS, UV-Vis spectroscopic techniques, thermal analyses, conductivity and magnetic data measurements. On the basis of these studies, a six coordinate octahedral geometry around the Co(II), Ni(II) ions in the complexes and a four coordinate square planner around Cu(II) complex has been proposed. Antifungal and antibacterial studies were carried out by performing Minimum Inhibitory Concentration (MIC80), Disc diffusion assay and WST1 cell cytotoxicity assay. The result showed that the test compounds possess potent anticandidial and antibacterial activities, when treated against different pathogenic fungi and bacteria. Key words: Hetroscorpionates, metal complexes, antimicrobial screening. ______________________________________________________________________________ INTRODUCTION Organylborates have found widespread use in a variety of application as biocides [1, 2] on account of their moderate to high level of biological activities [3, 4]. They display broad- spectrum activities against bacteria, fungi and insects when coupled with some toxic organic and organometallic compounds [5]. Borates along with organometals are commonly used in wood 133
Athar Adil Hashmi et al J. Chem. Pharm. Res., 2010, 2(3): 133-146 _____________________________________________________________________________ preservation [6, 7]. Despite their favorable attributes, high relative activity and low toxicity, low corrosiveness and non combustionability, the borates can be used in non exposed applications [6- 8]. There is substantial interest in the development of leach- resistant borates. H. Steinberg adopted to take advantage in the intrinsic ability of borate ions to form boroester with acids, aldehydes and phenols [9]. This ester formation provides a means of production of hydrostatic boron compounds [10]. Such mono carboxylic acid complexes of metals are widely used as antimicrobials and as catalysts [11-14]. The bioassay result has strong proof that some of the compounds are good acaricidals [15]. It has been reported that the metal complexes of organylborates such as Cu(II) Phosphane complexes of triazolyl borate ligands are particularly active against A549 carcinomas cells that are resistant to cis platin treatment [16]. Some mixed chelate copper based drugs have exhibited greater anti neoplastic potency than cis platin in invitro and invivo studies of a variety of tumor cell lines [17]. On the other hand organonickel and organocobalt complexes have also shown high antimicrobial activities against microorganisms like A. flavus, E. coli and C. albicans [18]. This study aims to develop a broad spectrum and low mammalian toxic organylborates and their metal complexes [Co(II), Ni(II), and Cu(II)], their systematic physico–chemistry and biological activity; therefore here we have reported the synthesis, characterization of the transition metal complexes of an organylborate ligand. Encouraging results on antibacterial and antifungal properties have been reported here for the first time. MATERIALS AND METHODS Physical Measurements Potassium borohydride (E. Merck, Ltd, India), benzoic acid (S.D.Fine-Chem. Ltd, India), and salicylaldehyde (S.D.Fine-Chem. Ltd, India) were purchased and used as received. The solvents were purchased from (Merck, India Ltd.). All solvents were degassed with dry nitrogen prior to use. Samples for micro analysis were dried in vacuum to constant weight. Elemental analyses were performed by a Perkin Elmer 2400 CHNSO elemental analyzer. IR spectra were recorded as KBr pellets using a Perkin Elmer 1620 FT IR spectrophotometer. Far IR spectra were recorded as CsI pellets in the region 650-100 cm-1 using a JASCO FT IR spectrophotometer. 1H NMR spectra were recorded using a Bruker DPX-300 MHz spectrophotometer operating at room temperature with DMSO-d6 as solvent. The chemical shift data (δ) are reported in parts per million (ppm) using tetramethylsilane as internal standard. Positive and negative ESI mass spectra were measured by Bruker (esquire3000_00037) instrument. Thermal analysis (TG/DTA) data were studied under nitrogen atmosphere using a SII Ex Star 6000 TG/DTA 6300 instrument. Magnetic susceptibility measurements were carried out from a microanalysis laboratory by Gouy method at room temperature. Electronic spectra were recorded on a spectro–UV-Vis Dual Beam 8 auto cell UVS–2700 LABOMED, INC, US spectrophotometer using DMSO as solvent at room temperature. Melting points were recorded on a Metrex melting point apparatus. Synthesis of ligand Potassium hydrobis (benzoato) (salicylylaldehyde) borate For the synthesis of ligand, same procedure was followed as reported in the reference [19]. Synthesis of Cobalt(II) complex A solution of CoCl2.6H2O (0.237 g, 1 mmol) dissolved in 20 ml methanol was added drop wise to a methanolic solution (20 ml) of the ligand (0.375 g, 1 mmol) with continuous stirring. The resulting solution was stirred for 6 h and the solution was concentrated to 30 ml. It was then allowed to stand overnight in a refrigerator. A light pink product separates out, which was isolated by filtration under vacuum. It was washed thoroughly with hexane and dried in vacuo 134
Athar Adil Hashmi et al J. Chem. Pharm. Res., 2010, 2(3): 133-146 _____________________________________________________________________________ over fused CaCl2. The compound was recovered in solid state and was recrystallized from methanol. Yield 53%, m.p.>300 oC. UV-Vis (DMSO) (nm) 520, 565, 682, 739, 824; IR (KBr, cm-1): 1318(B-O), 1565(C=O), 2370(B-H), 3059(C-H), 3454(H2O), 1067, 710; Far IR (CsI, cm- 1) 447 (Co-O), 335 (Co-Cl). 1H NMR (300 MHz, δ ppm from TMS in DMSO-d6, 300 k): δ 4.82- 4.91 (sbr, 1H, B-H), δ 3.79 (b, 1H, C-H), δ 7.55-7.61 (s, 4H, multiplet, salicylaldehydic ring), δ 7.32-7.51 and δ 7.88-7.97 (s, 10H, multiplet, phenyl ring); ESI MS (m/z) 507 [M]+, 509 [M+2]+. Molar conductance, Λm (Ω-1cm-1 mol-1, 10-3 DMSO, r.t.): 39.7. µeff (r.t., BM): 4.82. Anal. Found: C, 49.95; H, 4.02; O, 25.39; calcd for CoL(H2O)2Cl; C, 49.90; H, 3.95; O, 25.32% Synthesis of Nickel(II) complex The procedure followed was similar to that for the cobalt (II) complex except NiCl2.6H2O was used instead of CoCl2.6H2O. A light green product was obtained. It was recrystallized from methanol. Yield 52% m.p.>300 oC.; UV-Vis (DMSO) (nm) 410, 523, 682, 749, 857; IR (KBr, cm-1): 1333(B-O), 1550(C=O), 2368(B-H), 3056(C-H), 1070, 714; Far IR (CsI, cm-1) 456 (Ni- O), 345 (Ni-Cl). 1H NMR (300 MHz, δ ppm from TMS in DMSO-d6, 300 k): δ 4.84-4.92 (sbr, 1H, B-H), δ 3.80 (b, 1H, C-H), δ 7.58-7.63 (s, 4H, multiplet, salicylaldehydic ring), δ 7.33-7.53 and δ 7.89-7.93 (s, 10H, multiplet, phenyl ring).; ESI MS (m/z) 506 [M]+, 508 [M+2]+. Molar conductance, Λm (Ω-1cm-1 mol-1, 10-3 DMSO, r.t.): 40.1. µeff (r.t., BM): 3.25. Anal. Found: C, 49.95; H, 3.45; O, 20.49; calcd for NiL(H2O)2Cl; C, 49.92; H, 3.41; O, 20.46%. Synthesis of Copper (II) complex This complex was also synthesized in the same manner as in the above case except CuCl2.2H2O was used as the metal chloride. A sky blue product was obtained which was recrystallized from methanol. Yield 56%, m.p.>300 oC; UV-Vis (DMSO) (nm) 658; IR (KBr, cm-1): 1315(B-O), 1570(C=O), 2367(B-H), 3062(C-H), 3415(H2O); Far IR (CsI, cm-1) 487 (Cu-O), 314 (Cu-Cl). 1H NMR (300 MHz, δ ppm from TMS in DMSO-d6, 300 k): δ 4.84-4.94 (sbr, 1H, B-H), δ 3.82 (b, 1H, C-H), δ 7.59-7.65 (s, 4H, multiplet, salicylaldehydic ring), δ 7.34-7.56 and δ 7.90-7.95 (s, 10H, multiplet, phenyl ring); ESI MS (m/z) 476 M+, 478 [M+2]+. Molar conductance, Λm (Ω- 1cm-1 mol-1, 10-3 DMSO, r.t.): 38.3 µeff (r.t., BM): 1.91. Anal. Found: C, 53.24; H, 3.40; O, 20.27; calcd for CuLCl; C, 53.20; H, 3.37; O, 20.25%. Strains, Media, Growth conditions, and Experimental Protocols Candida albicans and Candida tropicalis were from clinical material: Candida albicans sequence number-3, S.T.D number-1220 and Candida tropicalis sequence number-6, S.T.D number- 126/9 were provided by S.T.D Lab, Department of Microbiology, Safdarjung Hospital New Delhi (India). Bacterial strains used in this study were obtained from Indian Institute of Integrative Medicines (IIIM) Jammu (India). Media, solvents used in this study were purchased from (Merck Ltd, India). Growth conditions Stock cultures were maintained on slants of nutrient agar (yeast extract 1%, peptone 2%, D- glucose 2% and agar 2.5%) at 4ºC. To initiate growth for experimental purposes, one loop full of cells from an agar culture was inoculated into 30 ml of YEPD (Yeast extract, Peptone, Glucose) nutrient medium and incubated at 37 0C for 24 hr i.e. up to stationary phase (primary culture). The cells from primary culture (108 cells/ml) were re-inoculated into 100ml fresh YEPD (Yeast extract, Peptone, Glucose) medium and grown for 8-10 hr i.e., up to mid-log phase (106 cells ml- 1). Microbial cultures, freshly grown at 37 0C were appropriately diluted in sterile YEPD broth to obtain the cell suspension at 106 CFU/ml. Bacterial stock cultures of S. aureus and E. coli were maintained on Luria agar. 135
Athar Adil Hashmi et al J. Chem. Pharm. Res., 2010, 2(3): 133-146 _____________________________________________________________________________ Determination of MIC80 Minimum inhibitory concentration was defined as the lowest concentration of the test molecule that causes (80%) growth inhibition of microbial cells. MIC80 was determined in vitro in liquid medium by serial broth dilution method [20]. Disc diffusion assay Inhibitory activity of KL, LNi, LCu and LCo on solid media against both the fungal and bacterial strains was determined with the help of Disc Diffusion Method [21]. Microbial cells (105 cells ml-1) grown in YEPD and Luria broth were mixed in molten media with agar (~40oC) and poured in a Petri plate. Different concentrations of the test compounds (dissolved in 10% DMSO) were spotted on the disc in 10µl volume. Diameter of zone of inhibition was recorded in millimeters after 3 days. WST1 cytotoxicity assay The assay was monitored with a spectrophotometer using adherent or cultured cell suspension in a micro-plate followed by incubation with WST-1. Appropriate concentration of the test compound is added to cell culture and then incubated for 24 hrs. 10µl of WST-1/CEC assay dye solution was added to each well. Plate was incubated for 30 minutes in cell culture incubator and shaken for 1 min. The reaction was stopped by adding 10µl of 1% SDS. WST-1 tetrazolium salt is reduced to formazan by cellular dehydrogenases. Generation of deep red colored formazan was measured at 450nm by BIORAD Microplate Reader, which then directly correlates to cell number [22]. RESULTSANDDISCUSSION The physical properties and analytical data of the ligand and its metal complexes support their proposed structure (Scheme. 1). The molar conductivity (Λm) of the metal complexes measured in 1×10⁻³ mol L-1 DMSO at room temperature shows values of 39.7, 40.1 and 38.3 Ω-1cm-1 mol-1 for the cobalt(II), nickel(II) and copper(II) complexes respectively. These low values indicate that they are non electrolyte species [23]. Elemental analysis results show that the composition of the complexes is in agreement with their formulation. Reaction Scheme ethanol 70oC Stirring KBH4 + 2(C7H6O2) + C7H6O2 K[HB2(C7H4O2) + C7H5O2] + 3H2 Benzoic acid Salicylal dehyde Ligand (KL) KL + CoCl2.6H2O / NiCl2.6H2O [CoL(H2O)2Cl] / [NiL(H2O)2Cl] + KCl methanol r.t Stirring Co(II) complex / Ni(II) complex methanol r.t KL + CuCl2.2H2O [CuLCl] + KCl Stirring Cu(II) complex 136
Athar Adil Hashmi et al J. Chem. Pharm. Res., 2010, 2(3): 133-146 _____________________________________________________________________________ Scheme 1: Synthesis of metal complexes [Co(II), and Ni(II), Cu(II)] O C O O C O OH2 O methanol B K+ H O + MCl2.6H2O B H M Cl stirring O O C O C O H C (M = Ni, Co) O OH2 H O C O methanol O C O K+ H B + CuCl2.2H2O C O stirring H O C O C O O H C B C O O H O O Cu Cl IR Spectra The IR Spectra of the ligand and its metal complexes firmly support the formation of these compounds. The ligand shows an important signal at 1325 cm-1 which justify the formation of a B-O stretching vibration [24]. Absences of a broad absorption and strong band in the region 3300–2800 cm-1 and 3600–3500 cm-1 shows that the hydrogen atom in carboxyl group of benzoic acid and hydroxyl hydrogen of salicylyldehyde are not present respectively and also indicates that the -OH group of benzoic acid and salicylyldehyde were deprotonated and converted into B-O bond in the ligand. Absorption of medium intensity near 2720 cm-1, accompanied by C=O absorptions is in agreement of the presence of aldehydic group, which clarifies that the hydroxyl group of salicylyldehyde is involved in the formation of B-O bond in the ligand. Absorption of a medium intensity near 2360 cm-1 shows the presence of B-H bond [25]. An insignificant shifting of the B-O stretching frequency in the metal complexes clarifies the non involvement of ester oxygen of ligand in coordination with boron. The >C=O stretching vibration (1595 cm-1) of the ligand shows significant shifting in the metal complexes. Moreover the presences of metal to oxygen bond vibration in the metal complexes firmly suggest that the carbonyl oxygen is coordinated to the metal atom in all the metal complexes. A new broad absorption band is seen in the region 3414-3454 cm-1 which indicates the presence of water molecule in the Co(II) and Ni(II) metal complexes and the absence of this region were seen in Cu(II) complex. Vibrating signals are seen at 447 cm-1, 456 cm-1 and 487 cm-1 in the spectra of the metal complexes of ligand, which gives us clear proof for the presence of Co-O, Ni-O, and Cu-O bonds respectively [26]. Other vibrating signals are seen at 335 cm-1, 345 cm-1, and 314 cm-1 in the spectra of metal complexes of ligand, gives us proof for the presence of Co- Cl, Ni-Cl and Cu-Cl bonds respectively [26]. 1H NMR Spectra In the 1H NMR spectra, two broad signals in the range δ 3.79-3.82 and δ 4.82-4.94 showed the presence of C–H bond and B–H bond in all the compounds respectively [27]. These protons show insignificant changes in all the metal complexes, which means non involvement of these protons during coordination. A sharp doublet in the range δ 7.83-7.95 and δ 7.3-7.49 shows protons at different locations of the phenyl ring (benzoic acid), where as a broad multiplets centered at δ 7.27-7.59 showed the presence of ring protons of salisaldehyde. These aromatic 137
Athar Adil Hashmi et al J. Chem. Pharm. Res., 2010, 2(3): 133-146 _____________________________________________________________________________ proton signals undergo down field shifting in all the metal complexes of the ligand, because of the paramagnetic effect of metal(II) ions. The benzoic protons of cobalt, nickel and copper complexes appeared in the range δ 7.32-7.91, δ 7.33-7.93, and δ 7.34-7.95 respectively and hence support the coordination of the ligand towards the metal ions [28-30]. Electro spray ionization mass spectra (ESI MS) The electro spray ionization mass spectra (ESI MS) of the ligand and the complexes were studied in DMSO solution. Fig.1. A positive ion ESI mass spectrum of the metal free ligand confirms the proposed formula by showing a peak at m/z 415.1 corresponding to the moiety [K (HBC21H15O6) atomic mass m/z 414]. The series of peaks in the range m/z 106.8, 158.7, 263, 381.1 etc., may be assigned to various fragments. Their intensity gives an idea of stability of the fragments. Similarly positive ion ESI-MS of the cobalt, copper, and nickel, complex show peaks at m/z 507, 476, and 506 respectively which are consistent with the molecular ion fragments and it supports the proposed structure of the complexes. [M+2]+ fragments were observed in all the metal complexes. This may be possible due to presence of isotopic chlorine in low quantities [31]. In some cases, the molecular ion peak was also associated with the solvent, water molecules and some adduct ions from the mobile phase solution [32, 33]. Fig 1. Electron spray ionization mass spectrum of the ligand (L). Electronic spectra The electronic spectra of all the metal complexes Fig.2 (a, b, c) measured in DMSO solvent support the geometry around the respective metal atom. The spectra of the cobalt(II) complex consist of transition bands at 520, 565 nm which are assigned to the transition 4T1g→4T1g(P), 682 nm which is assigned to the transition 4T1g→2T1g, and 739, 824 nm which are assigned to the transition 4T1g→4T2g. These transition bands establish an octahedral geometry around the cobalt (II) ion [34]. The electronic spectra of the nickel (II) complex showed transition bands at 410, 523 nm (shoulder) which are assigned to the transition 3A2g→3T1g (F), 682, 749 and 857 nm which are assigned to the transition 3A2g→3T2g. These bands indicate an octahedral geometry around the nickel (II) ion in its complex [35]. The spectra of the copper(II) complex exhibits a broad and low energy band at 658 nm which is attributed to d-d transition (2B1g→2A1g) typical for Cu(II) in a square planar environment [34]. 138
Athar Adil Hashmi et al J. Chem. Pharm. Res., 2010, 2(3): 133-146 _____________________________________________________________________________ Fig.2. Electronic spectra of the complexes (a) [CuLCl], (b) [CoL(H2O)2Cl], (c) [NiL(H2O)2Cl] Absorbance Absorbance 300 400 500 600 700 800 900 300 400 500 600 700 800 900 1000 wavelength (nm) wavelength(nm) (a) (b) Absorbance 300 400 500 600 700 800 900 1000 wavelength (nm) (c) Magnetic measurements. An indication of the most probable geometric configuration of the synthesized metal complexes is their magnetic moment values. The Co(II) complex has an effective magnetic moment value (µeff) of 4.82 BM. This value is indicative of an octahedral geometry around the cobalt (II) ion. The magnetic properties of octahedral cobalt(II) complexes are governed by the orbitally degenerating ground term 4T1g; this provides an orbital contribution to the magnetic moment so that the room temperature moments are experimentally found to be in the range 4.7-5.2 B.M [36, 37]. The Ni (II) complex possesses magnetic moment at µeff= 3.25 BM, which is in agreement with an octahedral geometry around the nickel(II) ion. Magnetic moment of octahedral Ni (II) complexes are expected to be well in excess of the spin only value, and typically lie in the range 3.2- 4.0 B.M [37]. The room temperature effective magnetic moment value of the copper(II) complex is 1.91 BM, which is corresponding to the presence of one unpaired electron and which supports a square planar geometry [38]. Thermo gravimetric analysis (TG/DTA) The thermal analysis (TG/DTA) of the ligand and its metal complexes were studied under nitrogen atmosphere at heating rate of 10oC/min. The TG/DTA of the ligand shows two major steps of weight loss (Fig.3). The first weight loss of 63.08% mass occurs between 115-240oC with a first inflexion point at 222oC. This weight loss corresponds to the loss of two benzene rings and a salisaldehyde ion (Theoretical mass 62.58%). This is an endothermic step as shown by DTA. After the first weight loss the remaining part of the ligand is stable up to 440oC and 139
Athar Adil Hashmi et al J. Chem. Pharm. Res., 2010, 2(3): 133-146 _____________________________________________________________________________ shows complete decomposition from 443-480oC with a second inflexion point on the DTA curve at 444oC. Complexes The thermal gravimetric (TG) analysis was used as a probe to proof the associated water or solvent molecules to be in coordination sphere or in crystalline form [39]. The thermo gram of nickel(II) and cobalt(II) complexes shows the first weight loss between 130-180oC which corresponds to loss of two coordinated water molecules and a chlorine ion (observed loss 13.7%; theoretical weight 14.14%) with the first inflexion point at 180oC. The second step is observed as continuous weight loss between 240-395oC corresponds to the loss of two benzene molecules and a salisaldehyde ion (observed loss 50.1%; theoretical weight 51.62%). This is an exothermic step with an inflexion point at 276oC. The remaining part of the Ni(II) and Co(II) complexes of the ligand are decomposed continuously from 395–600oC with inflexion points at 424 and 482oC. This is also an exothermic step. The TG/DTA of Cu(II) (Fig 4) complex is interestingly different than other two complexes showing no sign of coordinated water molecule in the complex, which confirms that complex, is anhydrous. It shows a small step of weight loss 6.69% mass from 240–280oC, corresponds to the loss of chlorine ion (theoretical 7.47%) with an endothermic inflexion point at 278oC. The complex shows the second major step of weight loss 69.81% (theoretical 70.34%) between 320- 470oC, with an exothermic inflexion point at 462oC. The remaining part of the Cu(II) complex decomposes completely from 500-600oC. Fig. 3. TG/DTA curve of the ligand (L) Fig. 4. TG/DTA curve of the Ni(II) complex 140
Athar Adil Hashmi et al J. Chem. Pharm. Res., 2010, 2(3): 133-146 _____________________________________________________________________________ Antimicrobial screening Minimum Inhibitory Concentration (MIC80) The MIC80 of the test compounds was determined against two fungal and two bacterial species using broth dilution method (BDM). From the results in (Table.1) it is clear that, in case of fungus generally the MIC80 of LNi < LCu < LCo< KL, where as in case of bacteria the MIC80 of LCu < LNi < LCo< KL respectively. Table 1: Minimum Inhibitory Concentrations MIC80 (µg/ml) of Bioactive Compound Species KL LNi C. albicans 1700 1000 C. tropicalis 1800 1200 E.coli 2000 1400 S.aureus 1900 1400 Disc Diffusion Assay Antibacterial activity (in vitro) of the ligand and its complexes was studied against one G+ and one G- bacteria at different concentrations. The data, summarized in Table-2, suggest that these test compounds show significant antibacterial activity. The highest zone of inhibition i.e. 15 mm was measured in S. aureus when treated against LCu, followed by 14mm and 13mm measured in E.coli and S.aureus when treated with LCu and LNi at higher concentrations. At much lower concentration of the test compounds (500µg/ml) the biological activity was less. In case of bacteria the order of inhibition was LCu >LNi > LCo > KL. Table 2: Antibacterial activity screening data as Zone of inhibition a(mm) µg/ml Bacteria KL * ** *** * ** *** S.aureus 01 02 04 09 11 13 E.coli 01 02 03 06 10 11 Cont-c - - - - - - a10-20 mm significant active, 05-10mm moderate active, <05 less active. bStandard drug Kanamycin (positive control). cSolvent 10% DMSO(negative control). * 500 µg/ml, ** 1000 µg/ml, *** 2000 µg/ml. For antifungal activity the highest inhibitory zone i.e. 16mm, 15mm and 14mm mm were measured in C. albicans and C. tropicalis when treated against LNi, LCu and LNi at highest concentrations. The results, summarized in Table.3 prove that in case of fungi for the entire tested organisms LNi proved more effective followed by LCu and LCo. Same thing was noticed here, in comparison to complexes, ligand KL showed much less antimicrobial activity. The LCu 1300 1300 1300 1200 LCo 1400 1500 1600 1500 Kb 18 16 - KL KL LNi LNi LNi LCu 10 07 - LCu ** 12 11 - LCu *** 15 14 - LCo 05 04 - LCo ** 07 06 - LCo *** 09 08 - * * * 141
Athar Adil Hashmi et al J. Chem. Pharm. Res., 2010, 2(3): 133-146 _____________________________________________________________________________ results showed that, in case of control disc no zone of inhibition was observed, so as far as our study is concerned 10% DMSO, as a solvent is having no effect on the tested organisms. Hence we can effectively conclude here that whole of the antimicrobial effect is due to the different concentration of the test compounds used in this study. Antifungal and antibacterial activities of the compounds when compared with standard antifungal and antibacterial drugs (Fluconazole, Kanamycin) showed significant and matching antimicrobial properties. Table 3: Antifungal activity screening data. Zone of inhibition a (mm) µg/ml Fungi KL * ** *** * ** *** C.albicans 01 03 04 10 13 16 C.tropicalis 01 02 03 08 12 14 Controlc - - - - - - a.10-20 mm significant active, 05-10mm moderate active, <05 less active. bStandard drug Fluconazole (positive control). cSolvent 10%DMSO(negative control). *500 µg/ml, ** 1000 µg/ml, *** 2000 µg/ml. WST1 Cytotoxicity assay Fig-5(a,b,c,d) give %Cytotoxicity of test compounds at different concentrations, calculated as: % Cytotoxicity = (100 × (cell control – Experimental) / (Cell control) The experiment was performed in triplicate and average %Cytotoxicity was calculated for all the test compounds. In Candida albicans highest concentration of the test compounds LNi (1000µg/ml), LCu (1300µg/ml), LCo (1400µg/ml), and KL (1700µg/ml), have a killing activity of 76%; 72%, 68% and 32% (Fig 5a). In Candida tropicalis LNi (1200µg/ml), LCu (1300µg/ml), LCo (1500µg/ml) and KL (1800µg/ml), possess mean killing activity of 71%, 63%, 62% and 23% respectively (Fig 5b). In case of tested bacteria highest concentration of test compounds compounds LNi (1400µg/ml), LCu (1300µg/ml), LCo (1600µg/ml), and KL (2000µg/ml have a killing activity of 57%; 60%, 51% and 21% when treated against E. coli (Fig 5c). While as in case of S.aureus at highest concentrations LNi (1400µg/ml), LCu (1200µg/ml), LCo (1500µg/ml), and KL (1900µg/ml) the %cytotoxicity was 58%, 53%, 47% and 17% (Fig 5d). Assay result indicates that higher concentration of the test compounds is inhibitory for cell proliferation and drastically reduces biomass of microbial cell culture (Table 4). Fig.5(a): Cytotoxic effect of different test compound concentrations against Candida albicans (Data represents Mean of three experiments) FCZb KL KL LNi LNi LNi LCu 09 07 - LCu ** 12 11 - LCu *** 15 13 - LCo 06 05 - LCo ** 08 07 - LCo *** 10 09 - * * 19 17 - * 90 80 %CYTOTOXICITY 70 60 50 40 30 20 10 0 1000µg/ml(LCu) 1300µg/ml(LCu) 1000µg/ml(LCo) 1400µg/ml(LCo) CONTROL 600µg/ml (LNi) 100µg/ml (LNi) 1000µg/ml (KL) 1700µg/ml (KL) 300 µg/ml (LNi) 500 µg/ml(LCu) 500 µg/ml(LCo) 500 µg/ml (KL) 142
Athar Adil Hashmi et al J. Chem. Pharm. Res., 2010, 2(3): 133-146 _____________________________________________________________________________ Fig.5(b): Cytotoxic effect of different test compound concentrations against Candida tropicalis. (Data represents Mean of three experiments) 80 70 %CYTOTOXICITY 60 50 40 30 20 10 0 CONTROL 1000µg/ml(LCu) 1300µg/ml(LCu) 1000µg/ml(LCo) 1500µg/ml(LCo) 1000µg/ml (LNi) 1200µg/ml (LNi) 1000µg/ml (KL) 1800µg/ml (KL) 300 µg/ml (LNi) 500 µg/ml(LCu) 500 µg/ml(LCo) 500 µg/ml (KL) Fig.5(c): Cytotoxic effect of different test compound concentrations against E. coli. (Data represents Mean of three experiments) 70 60 %CYTOTOXICITY 50 40 30 20 10 0 CONTROL 1000µg/ml(LCu) 1300µg/ml(LCu) 1000µg/ml(LCo) 1600µg/ml(LCo) 1000µg/ml (LNi) 1400µg/ml (LNi) 1000µg/ml (KL) 2000µg/ml (KL) 500 µg/ml (LNi) 500 µg/ml(LCu) 500 µg/ml(LCo) 500 µg/ml (KL) Fig.5(d): Cytotoxic effect of different test compound concentrations against S. aureus. (Data represents Mean of three experiments) 70 60 %CYTOTOXICITY 50 40 30 20 10 0 CONTROL 1000µg/ml(LCu) 1200µg/ml(LCu) 1000µg/ml(LCo) 1500µg/ml(LCo) 1000µg/ml (LNi) 1400µg/ml (LNi) 1000µg/ml (KL) 1900µg/ml (KL) 500 µg/ml (LNi) 500 µg/ml(LCu) 500 µg/ml(LCo) 500 µg/ml (KL) When Cell cytotoxicity assay was performed only a marginal decline in cytotoxicity was observed at lower concentrations, while at higher concentrations of test compounds mainly in case of LNi and LCu significant levels of cell cytotoxicity were observed. Tetrazolium salts are widely used as an assay for bacterial, fungal and mammalian cell viability and are widely used as indicators of cellular proliferation and biomass for eukaryotic and prokaryotic cells. Live cells reduce the tetrazole ring and a coloured formazan product is formed, which can be assessed visually and quantified spectrophotometrically. There are reports that such assays are used to test 143
Athar Adil Hashmi et al J. Chem. Pharm. Res., 2010, 2(3): 133-146 _____________________________________________________________________________ the efficiency of antifungal drugs in killing or inhibiting growth of Candida and other fungi [40- 42]. Assay result indicates that higher concentration of the test compounds is inhibitory for cell proliferation and drastically reduces biomass of microbial cell culture. Table. 4: %Cytotoxicity in presence of different test compound concentrations (µg/ml) against different bacteria and fungi C.albicans C.tropicalis Sample %Cytotoxicity Sample %Cytotoxicity Control 0 CONTROL 0 500 18.12 500 (KL) 14.32 1000 27.49 1000 (KL) 21.47 1700 32.43 1800 (KL) 23.3 300 36 300 (LNi) 31 600 58.45 1000 (LNi) 54.36 1000 76.4 1200 (LNi) 71.4 500 32.88 500 (LCu) 28.56 1000 57.34 1000 (LCu) 51.89 1300 72.1 1300 (LCu) 63.52 500 30.48 500 (LCo) 23.5 1000 53.67 1000(LCo) 48.67 1400 68.2 1500 (LCo) 62.56 CONCLUSION Chosen bacterial and fungal strains are highly pathogenic, causing, several diseases, are universally distributed in the environment, can be easily cultured in the laboratory, and test results can be obtained very quickly. The most important thing that was noticed in this study was that the complexes were much effective against fungus than in case of bacteria, and all of the fungal strains used in this study are responsible for causing candidiasis, a disease that varies from superficial mucosal to life threatening systemic disorders. Although little is known of the effects of these metal complexes on microbial processes, such compounds can inhibit a number of microbial processes and all relate to membrane functions. Present observations may serve as a guide for studying the control release of these complexes and could be a promising future in the field of infectious diseases. Another thing that was noticed in this study was that the metal complexes have higher activities as compared to that of the parent ligand when treated against the same microorganism. Such increased activity of the metal complexes may be due to chelation of the metal ion in the complex [43], which enhances the lipophylic character favoring its permeation through the lipid layer of cell membrane. Other factors viz. stability constant, molar conductivity, solubility and magnetic moment are also responsible for increasing the antimicrobial activity of the complexes [44]. As far as our results are concerned these metal complexes can thus be explored in future as an option for decreasing pathogenic potential of infecting bacterial and fungal species. Acknowledgements The authors are highly thankful to University Grants Commission (UGC) India for their financial assistance. REFERENCES [1]WG Woods. Environ Perspect.1994,102, 5-11. [2]MC Miller; BF Spielvogel; IH Hall. Appl. Organometal. Chem. 1998, 12, 87-97. [3]DM Schubert. Structure and Bonding2003, 105, 2-40. E.coli %Cytotoxicity 12.43 16.17 21.39 28.45 49.32 60.34 23.51 S. aureus %Cytotoxicity Sample CONTROL 500 (KL) 1000 (KL) 2000 (KL) 500 (LNi) 1000 (LNi) 1400 (LNi) 500 (LCu) 1000 (LCu) 1300 (LCu) 500 (KL) 1000 (KL) 1600 (LCo) Sample CONTROL 500 (KL) 1000 (KL) 1900 (KL) 500 (LNi) 1000 (LNi) 1400 (LNi) 500 (LCu) 1000 (LCu) 1200 (LCu) 500 (LCo) 1000 (LCo) 1500 (LCo) 0 0 10.11 13.2 17.43 24.11 43.67 58.5 27.45 46.78 53.34 20.22 36.89 47.23 25 45 57 42 51 144
Athar Adil Hashmi et al J. Chem. Pharm. Res., 2010, 2(3): 133-146 _____________________________________________________________________________ [4]H Stevens; WC Vander; P Santens; HML Jansen; JDe Reuck; R Dierckx; J Korf. J. Nucl. Med. 1998, 39, 495-498. [5]R Cockcroft; JF Leavy. J. Inst. Wood Sci. 1973, 6, 28-37. [6]PD Woodgate; GM Horner; NP Maynard; CEF Rickard. J. Organometal. Chem.1999, 590, 52-62. [7]M Hedley; D Page; B Patterson. 31st Annual Meeting of the International Research Group on Wood Preservation, 2000, 0- 30222. [8]JD Lloyed; JL Fogel; A Vezel. 32nd Annual Meeting of the International Research Group on Wood Preservation,2001, 1-30256. [9]H Steinberg. Organoboron Chemistry, Vol. 1 Interscience: London, 1964, 1-816. [10]DG Humphrey; PJ Duggan; EM Tyndall; JM Carr; LJ Cookson. In 33rd Annual Meeting International Research Group on Wood presentation, 2002, 2-30283. [11]HD Yin; CH Wang; Y Wang; CL Ma. Chin.J. Inorg. Chem.2001, 17, 806. [12]HD Yin; CH Wang; Y Wang; RF Zhang; CL Ma; XC Tao. Chin J. Inorg Chem. 2001, 19, 783. [13]HD Yin; CH Wang; Y Wang; CL Ma; JXC Shao. Acta Chim. Sin.2002, 60,143. [14]WR Harris. J. Coord. Chem.1983, 13, 17-28. [15]X Fang; X Song Q Xie. J. Organometal. Chem. 2001, 619, 43- 48. [16]C Marzano; M Pellei; S Alidori; A Brossa; GG Lobbia; F Tisato; C Santini. J.Inorg. Biochem. 2006, 100, 299-304. [17]ADeV Ruiz; AR Mueller; LR Ramirez; GEN Kass; LR Kelland; RM Orr; M Dobrota; Toxicol. In Vitro.2004,14, 1-5. [18]A Kumar; D Kumar; ARKIVOC. XIV 2007, 117-125. [19]R Joshi; GS Sharma; V Kumar; AA Hashmi; S Kumar; R Achila; ME Hussain. Appl.Organometal. Chem.2006, 20, 740-746. [20]KG Davey; A Szekely; EM Johnson; DW Warnock. J. Antimicrob. Chemother. 1998, 42(4), 439-444. [21]K Mukhopadhyay; A Kohli; R Prasad; Antimicrob. Agents Chemother.2002, 46(12), 3695- 3705. [22]RP Perez; AK Godwin; LM Handel; TC Hamilton. Eur. J. Cancer.,1993, 29A, 395-399. [23]W Geary. J.Coord. Chem. Rev1971, 7, 81- 122. [24]SG Sharma; SR Ahmad; S Shreaz; HA Adil; KL Ahmad. Chin. J Chem.2009, 27, 1300- 1306. [25]S Trofimenko. J. Am. Chem. Soc.1967, 89, 3165-3170. [26]K Nakamoto. Infrared spectra of Inorganic and Coordination compounds, John Wiley International, New York 1970. [27]C Santini; GG Lobbia; C Pettinari; M Pellei. Inorg. Chem.1998, 37, 890-900. [28]A Chaudhary; RV Singh. Indian J. Chem.,2004, 43, 2529-2535. [29]RM Silverstein; FX Webster. Spectroscopic Identification of organic Compounds, 6th Edn, John Wiley and Sons. Inc. New York 1998. [30]ZA Siddiqi; SM Shadab. Indian J. Chem.,2004, 43, 2274-2280. [31]W Kemp. Organic Spectroscopy, The Macmillan Press Ltd 1975. [32]M Yamashita; JB Fenn. J. Phys. Chem.1984, 88, 4451-4459. [33]M Mann. Org Mass spectrum.1990, 25, 575-587. [34]ABP Lever, Inorganic electronic Spectroscopy (Second ed.), Elsevier, Amsterdam 1984. [35]R Han; A Looney; KMc Neill; G Parkin; AL Rheingold; BS Haggerty. J. Inorg. Biochem. 1993, 49, 105-121. [36]BN Figgis. Introduction to ligand field theory, John, Wiley, New York 1996. [37]BN Figgis; J Lewis. Progress in Inorganic Chemistry. Wiley Interscience New York, 1964, 6, 37-239. 145
Athar Adil Hashmi et al J. Chem. Pharm. Res., 2010, 2(3): 133-146 _____________________________________________________________________________ [38]M Sonmez. Turk J. Chem. 2001, 25, 181-185. [39]AAA Emara; FSM Abd El-Hameed; SME Khalil. Phosphorus, Sulfur Silicon, 1996, 114, 1- 15. [40]DM Kuhn; M Balkis; J Chandra; PK Mukherjee; MA Ghannoum. J Clin. Microbiol.,2003, 41, 506-508. [41]J Meletiadis; JW Mouton; JF Meis; BA Bouman; JP Donnelly; PE Verweij; E Network. J. Clin. Microbiol, 2001, 39, 3402-3408. [42]NP Wiederhold; DP Kontoyiannis; RA Prince; RE Lewis. Antimicrob. Agents Chemother., 2005, 49, 5146-5148. [43]A Chaudary; RV Singh. Phosphorous, Sulphur and Silicon,2003, 178, 603-613. [44]RA Sheikh; S Shearz; LA Khan; AA Hashmi. J. Chem. Pharm. Res.,2010, 2(2), 172-185. 146