Download
1 / 8
80 likes | 113 Views
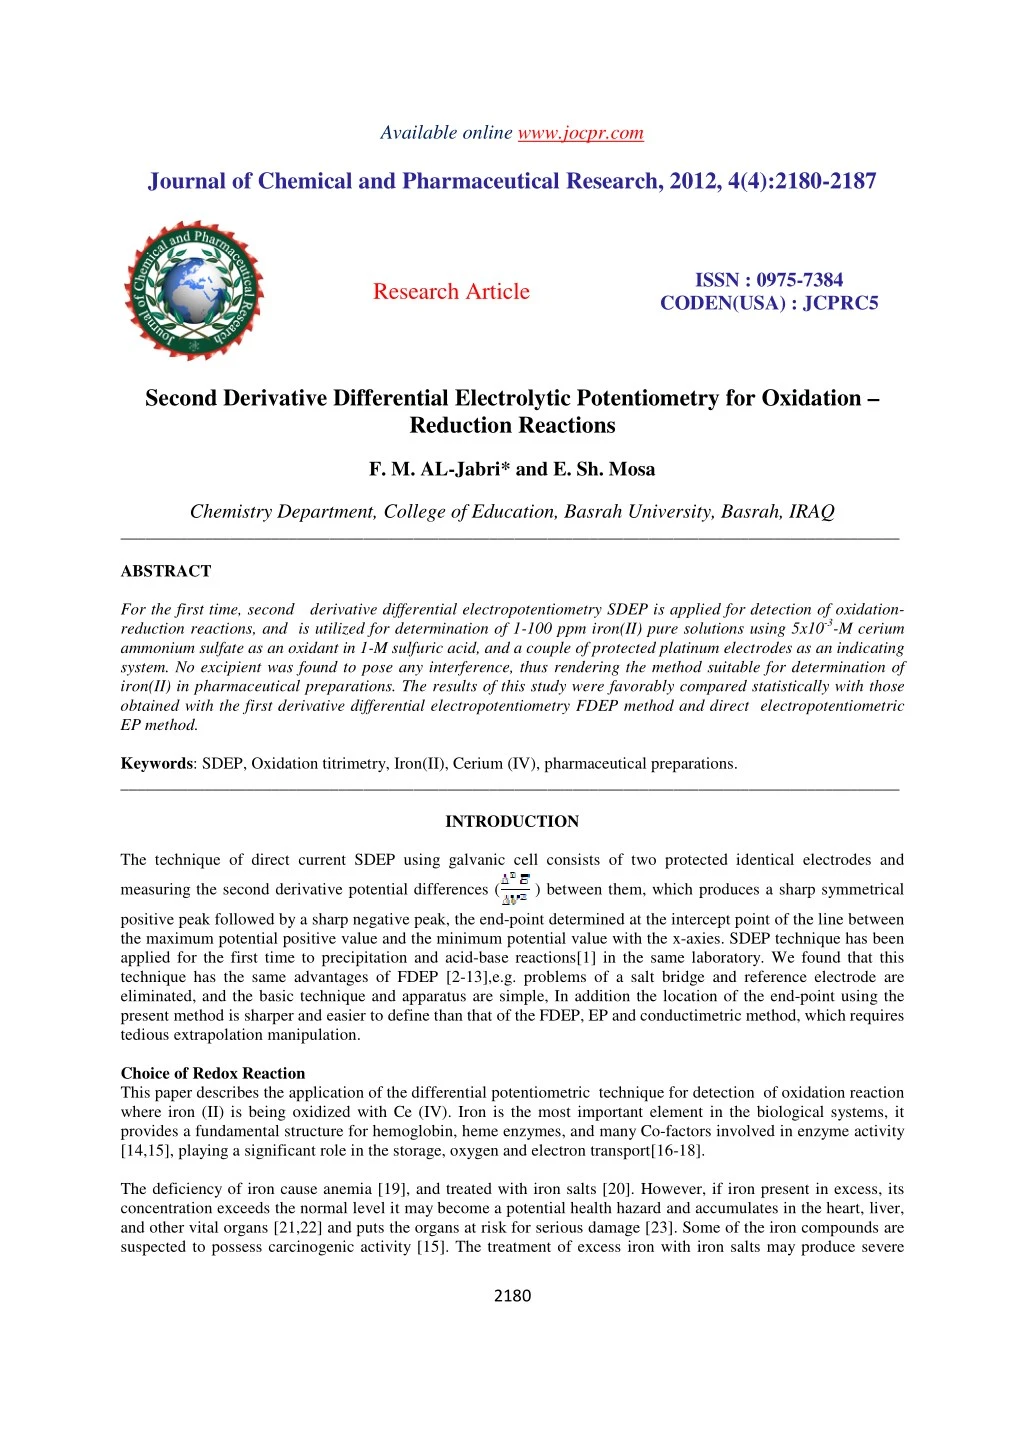
For the first time, second derivative differential electropotentiometry SDEP is applied for detection of oxidationreduction reactions, and is utilized for determination of 1-100 ppm iron(II) pure solutions using 5x10<br>-3-M cerium<br>ammonium sulfate as an oxidant in 1-M sulfuric acid, and a couple of protected platinum electrodes as an indicating<br>system. No excipient was found to pose any interference, thus rendering the method suitable for determination of<br>iron(II) in pharmaceutical preparations. The results of this study were favorably compared statistically with those<br>obtained with the first derivative differential lectropotentiometry FDEP method and direct lectropotentiometric EP method.

E N D
Available online www.jocpr.com Journal of Chemical and Pharmaceutical Research, 2012, 4(4):2180-2187 ISSN : 0975-7384 CODEN(USA) : JCPRC5 Research Article Second Derivative Differential Electrolytic Potentiometry for Oxidation – Reduction Reactions F. M. AL-Jabri* and E. Sh. Mosa Chemistry Department, College of Education, Basrah University, Basrah, IRAQ _____________________________________________________________________________________________ ABSTRACT For the first time, second derivative differential electropotentiometry SDEP is applied for detection of oxidation- reduction reactions, and is utilized for determination of 1-100 ppm iron(II) pure solutions using 5x10⁻³-M cerium ammonium sulfate as an oxidant in 1-M sulfuric acid, and a couple of protected platinum electrodes as an indicating system. No excipient was found to pose any interference, thus rendering the method suitable for determination of iron(II) in pharmaceutical preparations. The results of this study were favorably compared statistically with those obtained with the first derivative differential electropotentiometry FDEP method and direct electropotentiometric EP method. Keywords: SDEP, Oxidation titrimetry, Iron(II), Cerium (IV), pharmaceutical preparations. _____________________________________________________________________________________________ INTRODUCTION The technique of direct current SDEP using galvanic cell consists of two protected identical electrodes and measuring the second derivative potential differences ( ) between them, which produces a sharp symmetrical positive peak followed by a sharp negative peak, the end-point determined at the intercept point of the line between the maximum potential positive value and the minimum potential value with the x-axies. SDEP technique has been applied for the first time to precipitation and acid-base reactions[1] in the same laboratory. We found that this technique has the same advantages of FDEP [2-13],e.g. problems of a salt bridge and reference electrode are eliminated, and the basic technique and apparatus are simple, In addition the location of the end-point using the present method is sharper and easier to define than that of the FDEP, EP and conductimetric method, which requires tedious extrapolation manipulation. Choice of Redox Reaction This paper describes the application of the differential potentiometric technique for detection of oxidation reaction where iron (II) is being oxidized with Ce (IV). Iron is the most important element in the biological systems, it provides a fundamental structure for hemoglobin, heme enzymes, and many Co-factors involved in enzyme activity [14,15], playing a significant role in the storage, oxygen and electron transport[16-18]. The deficiency of iron cause anemia [19], and treated with iron salts [20]. However, if iron present in excess, its concentration exceeds the normal level it may become a potential health hazard and accumulates in the heart, liver, and other vital organs [21,22] and puts the organs at risk for serious damage [23]. Some of the iron compounds are suspected to possess carcinogenic activity [15]. The treatment of excess iron with iron salts may produce severe 2180
F. M. AL-Jabri et al ____________________________________________________________________________ J. Chem. Pharm. Res., 2012, 4(4):2180-2187 poisoning [20]. Hence, there is a need for iron ion determination in clinical, medicinal, environmental and different industrial samples [24-31]. Presently, various sophisticated techniques are employed [32-49]. However, these methods are disadvantageous in terms of cost and unsuitability for routine analysis. On the other hand, although the EP [1, 50, 51] and potentiometric method with ion selective electrodes [52-59] are simple, cheap, convenient and fast, there are some limitations of these techniques. On solution for these limitations is the use of differential electropotentiometry. We have now developed both the FDEP and SDEP methods for the determination of iron(II), the methods now developed do not suffer from any of the disadvantages associated with the earlier methods. EXPERIMENTAL SECTION Apparatus WTW Instrument model pH DIGI520 D8120 digital potentiometer was used for potentiometric measurements. A bright platinum and a saturated calomel electrode serve as indicator and reference electrodes respectively. The platinum electrodes were Sargent Welch type 30-415 and were cleaned with concentrated sulfuric acid and/or nitric acid, rinsed with distilled deionized water and, placed in the cell. Flawil Magnetic stirrer, model H-9230/SG was used for solutions stirring. Materials and Reagents All solutions were prepared with double distilled water from reagent-grade materials and were used as supplied without Further purification. Cerium ammonium sulfate was obtained from Fluka, Switzeland and concentrated sulfuric acid (95-97%) by Riedel de Haen was used for the preparation of Ce(IV) and iron (II) stock solutions in 1- M sulfuric acid. Ferrous ammonium sulfate hexahydrate, Fluka was used to prepare a stock solution of 1000 ppm. Working solutions were prepared from the stock solution by dilutions. Calcium chloride, cadmium chloride, magnesium sulfate, aluminium nitrate, boric, sulfanilic, Tartaric acids, were obtained from BDH, England. Zinc sulfate heptahydrate, citric, and succinic acids were obtained from E.Merck, Germany. Ammonium benzoate was obtained from Fluka. 0.005-M Ce(IV) in 1-M sulfuric acid was prepared by dissolving 0.3162g of hydrous cerium ammonium sulfate in 5.5 ml of concentrated sulfuric acid and 50 ml distilled water in a 100-ml volumetric flask and made up to 100 ml with distilled water. A 1000 ppm solution of iron(II) was prepared daily by dissolving 0.7022g of ferrous ammoniumsulfate hexahydrate in 5.5 ml concentrated sulfuric acid and 50 ml distilled water in a 100-ml volumetric flask and made up to 100 ml with distilled water, and standardized against a standard solution of dichromate[60]. Other iron(II) solutions were prepared by diluting with distilled water. A 1000 ppm solutions of various metals using for interference study were prepared by dissolving 0.2769, 0.2303, 0.4952, 0.4397 and 1.390 g of calcium chloride, hydrous cadmium chloride, hydrous magnesium sulfate, zinc sulfate heptahydrate, and hydrous aluminium nitrate respectively in 100 ml distilled water with constant stirring. A 1000 ppm solution of various organic meterials using for interference study were prepared by dissolving 0.1 g of boric, citric, succinic, sulfanilic, tartaric acids and ammonium benzoate in 100 ml distilled water with constant stirring. Procedures (I) Recommend Direct EP method procedure A 100 ml volume of standard iron(II) solution containing 1-100 mg was transferred to the titration cell. The platinum and calomel electrodes were immersed into the sample solution. The analysis was done by running cerium ammonium sulfate solution from 1-ml micro burette, graduated at 0.001-ml for low concentration solutions, and 10.0-ml micro burett, graduated at 0.01-ml for high concentration solutions slow intervals and constant stirring of the reactions was continued with an electromagnetic stirrer throughout the course of titration. The potential (E mv) were recorded at a stable reading after each addition. The exact volume of the titrant was read from graph plotted between E mv values and titrant volume. 2181
F. M. AL-Jabri et al ____________________________________________________________________________ J. Chem. Pharm. Res., 2012, 4(4):2180-2187 (II) FDEP method procedure A 100 ml volume of standard iron(II) solution containing 1-100 mg was transferred to the titration cell, which consists of a duplicate platinum electrode assembly. The titration cell is prepared as shown in Fig.1(a). Fig.1: A schematic diagram of a)FDEP b) SDEP cells assembly. A and B are platinum electrodes immersed in the iron(II) solution, the electrode B is enclosed in a glass jaket with a small orifice at one end. Initially the solution around each platinum electrode will contain iron(II) ions of the same activity and there will be no difference of potential between them. A small amount, ∆ν ml, of cerium ammonium sulfate solution is added from the burette C to the iron(II) solution. The solution surrounding electrode A will undergo a decrease in iron(II) ion activity and hence its potential will decrease. The potential of electrode B will, however, remain as before because the solution surrounding this electrode isolated from the bulk of the solution, with the result that there will have been no change in the iron(II) activity. A difference of potential ∆E will thus exist between the two electrodes. The solution around electrode B is then expelled by means of the rubber teat D. On refilling this compartment all of the solution in the system will be homogeneous and the difference of potential between the electrodes will again be zero. This procedure is then repeated by adding a further small volume, ∆ν ml of cerium ammonium sulfate solution, and the ∆E value measured. This process is continued until the titration is complete and the full differential curve obtained. The initial addition of the cerium ammonium sulfate can be quite rapid as the end point will be apparent from the increasing ∆E value. (III) SDEP method procedure A 100 ml volume of standard iron(II) solution containing 1-100 mg was transferred to the titration cell, which consists of a duplicate platinum electrode assembly. The titration cell is prepared as shown in Fig.1 (b). A and B are platinum electrodes immersed in the iron (II) solution, the electrodes A and B are enclosed in a glass jakets with a small orifice at one end. Initially the solution around each platinum electrode will contain iron (II) ions of the same activity and there will be no difference of potential between the electrodes. A small amount, ∆ν ml, of cerium ammonium sulfate solution is added. The solution around electrode A is then expelled by means of the rubber teat D and refilling this compartment. This procedure is then repeated by adding a further small volume, ∆ν ml of cerium ammonium sulfate solution. The solution around electrode B is then expelled by means of the rubber teat E and refilling this compartment from the mother solution after the second addition, on repeating this process and expelling and refilling of A and B compartments after each addition alternatively, and the ∆2E value measured. This process is continued until the titration is complete and the full second derivative differential curve obtained. . The initial addition of the cerium ammonium sulfate can be quite rapid as the end point will be apparent from the increasing ∆2E positive values before the end point and the decreasing ∆2E value (-ve values) after the end point immediately. 2182
F. M. AL-Jabri et al ____________________________________________________________________________ J. Chem. Pharm. Res., 2012, 4(4):2180-2187 (IV) Procedure for the Determination of Iron (II) in Dosage Forms Ten tablets containing iron (II) or the contents of 10 capsules were weighted and pulverized. An appropriate amount of the power equivalent to 10 mg of iron (II) was dissolved in about 50 ml of water. It was left for 10 min in the dark to let the gases evaporated and the residue was filtered and washed 3-4 times with water, then was added about 5.5 ml concentrated sulfuric acid. The mixture was made up to the mark with water in a 100-ml volumetric flask. An accurately measured volume of the solution was transferred and continued using the previously stated potentiometric analytical procedures, I,II and III. RESULTS AND DISCUSSION The SDEP technique as a detection system has been employed for the first time for the oxidation of iron (II) to iron (III) with cerium (IV) in sulfuric acid media through the following reaction: Ce4+ + Fe2+ Ce3+ + Fe3+ , and applied to follow the titration of iron (II) with Ce (IV) in sulfuric acid solution, a differential curves will be obtained and used to locate the end point. The peaks obtained were highly reproducible compared with those obtained with FDEP and direct EP methods, the smoothness, the sharpness and the symmetry of the differential curves depend on the applying of special modified potentiometric procedure (III) indicating the normal behavior of the platinum electrodes which are used as an indicating system without reference electrode and salt bridge, this procedure was found to be suitable for oxidation-reduction reactions, and was employed in this work. Figure 2. Titration of 100mL of a) 10ppm iron (II) b) 100 ppm iron (II) with 0.005 M ammonium cerium (IV) sulfate using EP method The applied methods were calibrated by running series of iron (II) standard solutions to examin the response of these methods and also to detect the lowest concentration that can be determined. Iron(II) was determined in the concentration range 1-100 ppm. Results for the determination of iron (II) in pure form are compared with the results obtained by FDEP and EP methods (table 1), and indicate no significant differences between them with respect to accuracy and precision. A set of the titration curves obtained were shown in Figures 2-4. The results in table 1 indicates the successful applicability of the proposed method, which was simple, easy to detect the end-points, and requires small amount of oxidants. 2183
F. M. AL-Jabri et al ____________________________________________________________________________ J. Chem. Pharm. Res., 2012, 4(4):2180-2187 The results of interference study in table 2 prove that the proposed method suffers no interference from excipients added to iron(II) drug formulations, so this method was applied to the determination of iron (II) in some proprietary drugs as introduced in table 3 , the results obtained were compared with the results of analysis of the same batch of samples with FDEP and EP methods . The statistical calculations indicates high precision with low standard deviation and a reasonable percentage recovery. Figure 3. Titration of 100mL of a) 10ppm iron (II) b) 100 ppm iron (II) with 0.005 M ammonium cerium (IV) sulfate using FDEP method Table 1: Potentiometric analysis of iron (II) standard solutions by application of EP, FDEP and SDEP methods Amount,µg/ml A.E % Recoveries % R.S.D Found* FDEP Taken EP FDEP SDEP EP FDEP SDEP EP FDEP SDEP EP SDEP - 1 1.0038 0.9843 1.0038 0.0038 0.0038 100.3849 98.4303 100.3849 0.1966 0.9872 0.9834 0.0156 0.0192 0.0454 - 0.0277 5 10 4.997 10.0175 5.0192 10.0454 5.0052 10.0035 -0.0002 0.0175 0.0052 0.0035 99.3849 100.1755 100.3849 100.4547 100.1057 100.0359 0.0394 0.0985 0.19669 0.0982 0.1983 0.0986 20 20.0002 19.9722 20.0002 0.0002 0.0002 100.0010 99.6402 99.9940 0.0093 0.0660 0.0131 - 30 30.0010 30.0107 29.9968 0.0010 0.0107 100.0033 100.0359 99.9893 0.01316 0.0329 0.0329 0.0031 - 0.0073 - 50 50.0054 49.9900 49.9926 0.0054 100.0108 99.9800 99.9853 0.0157 0.0197 0.0197 0.0099 - 0.0446 0.0463 - 0.0268 70 69.9972 69.9553 70.0111 -0.0027 0.0111 99.9960 99.9362 100.0159 0.0141 0.0141 0.0141 90 89.9848 90.0463 90.0044 -0.0151 0.0044 99.9831 100.0514 100.0049 0.02413 0.0109 0.0109 100 100.0080 99.9731 100.0038 0.00801 0.0038 100.0080 99.9731 100.0038 0.01974 0.0098 0.0059 *average of three determinations A.E : Absolute Error ; R.S.D: Relative Standard Deviation 2184
F. M. AL-Jabri et al ____________________________________________________________________________ J. Chem. Pharm. Res., 2012, 4(4):2180-2187 Table 2: Interference study of foreign species in determination of 10 µg/ml of iron (II) Foreign species & Fold Ca(II) 10.0343 Amount found, µg/ml A.E % Recoveries % R.S.D EP FDEP SDEP EP FDEP SDEP EP FDEP SDEP EP FDEP SDEP 10.0315 10.0454 10.0035 0.0315 0.0454 0.0035 100.3151 100.4547 100.0359 0.0984 0.0982 0.0986 10.0454 10.0077 0.0343 0.0454 0.0077 100.3430 100.4547 100.0778 0.0590 0.0982 0.0394 1 10.0259 9.9198 10.0049 0.0259 -0.0801 0.0049 100.2593 99.1982 100.0499 0.0196 0.0995 0.0789 Cd(II) 10.0021 9.9198 10.0035 0.0021 -0.0801 0.0035 100.0219 99.1982 100.0359 0.0789 0.0995 0.0986 1 10.0035 10.0454 10.0035 0.0035 0.0454 0.0035 100.0359 100.4547 100.0359 0.0986 0.0982 0.0986 Zn(II) 9.9756 10.0454 10.0091 -0.0243 0.0454 0.0091 100.7567 100.4547 100.0917 0.0989 0.0982 0.0197 1 10.2893 9.9198 10.0035 0.2893 -0.0801 0.0035 100.8935 99.1982 100.0359 0.1972 0.0995 0.0986 Mg(II) 10.4782 9.9198 10.0035 0.4782 -0.0801 0.0035 100.7893 99.1982 100.0359 0.0942 0.0995 0.0986 1 10.0035 10.0454 10.0008 0.0035 0.0454 0.0008 100.0358 100.4547 100.0080 0.0987 0.0982 0.0592 Al(III) 10.0102 10.0454 10.0035 0.0102 0.0454 0.0035 100.1025 100.4547 100.0359 0.2013 0.0982 0.0986 1 9.8918 10.0454 10.0063 -0.081 0.0454 0.0063 98.9189 100.4547 100.0638 0.0987 0.0982 0.0591 Benzoate 9.1984 10.0454 10.0035 -0.0815 0.0454 0.0035 99.1842 100.4547 100.0359 0.07962 0.0982 0.0986 1 9.9156 9.9198 10.0175 -0.0843 -0.0801 0.0175 99.1561 99.1982 100.1755 0.0401 0.0995 0.1393 Boric acid 9.9435 9.9182 10.0189 -0.0564 -0.0801 0.0189 99.4355 99.1982 100.1895 0.0397 0.0995 0.1182 1 10.1641 10.0454 10.0175 0.1641 0.0454 0.0175 101.6415 100.4547 100.1755 0.3895 0.0982 0.0985 Citric 10.1571 10.0454 10.0035 0.1571 0.0454 0.0035 101.5717 100.4547 100.0359 0.0971 0.0982 0.0986 1 10.0077 10.0454 10.0035 0.0077 0.0454 0.0035 100.0778 100.4547 100.0359 0.0394 0.0982 0.0986 Succinic 10.0035 10.0454 10.0049 0.0035 0.0454 0.0049 100.0353 100.4547 100.0499 0.0986 0.0982 0.11841 1 9.9198 10.0454 10.0035 -0.0801 0.0454 0.0035 99.1982 100.4547 100.0359 0.0995 0.0982 0.0986 sulfamic 9.9198 10.0454 10.0063 -0.0801 0.0454 0.0063 99.1982 100.4547 100.0638 0.0995 0.0982 0.0591 1 10.0105 9.9182 10.0035 0.0105 -0.0801 0.0035 100.1057 99.1982 100.0359 0.1970 0.0995 0.0986 Tartaric 10.0312 9.9182 10.0091 0.0312 -0.0801 0.0091 100.3124 99.1982 100.0917 0.1025 0.0995 0.0197 1 Figure 4. Titration of 100mL of a) 10ppm iron (II) b) 100ppm iron (II) with 0.005M ammonium cerium (IV) sulfate using SDEP method 2185
F. M. AL-Jabri et al ____________________________________________________________________________ J. Chem. Pharm. Res., 2012, 4(4):2180-2187 Table 3 : Determination of 10 µg/ml of iron (II) in some pharmaceutical preparations Amount Found ,µg/ml A.E EP FDEP SDEP EP FDEP 10.0454 9.9198 10.0035 0.0454 -0.0801 9.9896 9.9198 10.0035 -0.0103 -0.0801 9.8918 9.9194 10.0035 -0.1081 -0.0815 10.0035 9.9198 10.0035 0.0035 -0.0801 Ferrous sulphate W/ Folic acid Ferro-Fol 10.0943 10.1222 10.1152 0.0943 Feeful 10.0035 10.0454 10.0175 0.0035 Ferocit-TR 9.9477 9.9198 10.0035 -0.0522 CONCLUSION The applicability of a simple and fast SDEP as a detector for oxidation-reduction reactions was investigated successfully and for précis determination of iron (II) in pure form and in its dosage forms. This technique has the advantage over the previously reported methods with respect to specificity and sensitivity, and requires cheaper instrumentation and a simple electric circuit with only two platinum electrodes. The applied method is superior compared with other methods at it is faster and more suitable for routine analysis. In addition the location of the end- point using the present method is sharper and easier to define than that of the FDEP, direct EP, and conductimetric method, which requires tedious extrapolation manipulation. REFERENCES [1] I.K.Al-Asadi, M. Sc. Thesis, "Spectrophotometric studies of some Dyes forming Reactions and second Derivative potentiometric measurements " , University of Basrah (2000). [2] E. Bishop and G. D. Short , Analyst , 87 , 467 , (1962). [3] G. D. short and E. Bishop, Analyst, 89, 415, (1964). [4] A .M. S. Abdennabi and E. Bishop , Analyst , 107 , 1032 (1982). [5] E . Bishop and A. M .S Abdennabi , Analyst ,108 ,1349 (1983). [6] A . M . S . Abdennabi and M. Rashid, AJSE, 12 , 92 (1986). [7] F.M.Al-Jabri and S.G.Al.Mhana, J.Basrah.Res., 15,19 (1998). [8] A.M.S.Abdennabi ,M.Koken,Talanta ,46 ,639 (1998). [9]A .M . S .Abulkibash, M. Koken, M.M.Khaled and S.M.Sultan, Talanta , 52 ,1139 (2000). [10] R.M .S .Abulkibash ,S.M Sultan , A .M .Al – Olyan and S.M .Al Ghonnam , Talanta,61,239 (2003). [11] S.M . Al – Ghannam , I1 Farmaco ,59 ,331(2004). [12] A.M. S. Abulkibash , S.M .Al- Ghannam and A.M .Al- Olyan , J.AOAC Int., 87,671(2004). [13] S.M. Al- Ghannam and A.M.Al- Dlyan , J.of food and drug Analysis , 13 (4) , 295(2005). [14] R . Maleki , R . Hosseinzadeh , H .Mehrabi , A . Hassanzadeh and k .farhadi , Turk .J.Chem., 1(2009). [15] V.K. Gupta, B. Sethi, N.Upadhyay, S. Kumar, R. Singh and L.P. Singh, Int. J. Electrochem . Sci., 6,650(2011). [16] R.A. Goyer, Toxic effects of metals, in : C.D . Klaassen (Eds) , Casarett & Doull's Toxicology : the basic science of poisons , 5th . New york city , Ny , MeGraw- Hill, 1996 , pp. 715 -716 . [17] W. F .Greentree and J.O. Hall, Iron toxicosis, in : J.D.Bonagura, (Eds.), kirk'scurrent therapyXII small animal practice. Philadelphia, pa,WB Saunders Co.,1995.p.240 -242. [18] N.N . Green wood , A. Chemistry of Elements , Pergamon Press , Oxford , (1984). [19] M.Wintrole , Clinical Hematology , Lea& Febiger , Philadelphia , 1961 pp.143 . [20]R.D.Musser and J.D'Neil,pharmacology & Therapeutics , The Macmillan Company ,1969 . [21] J.Porter , Pathophysiology of iron overload, Hematol Oncol Clin North Am., 19,7(2005). [22] N.C. Andrews , N Eng J med., 341 ,1986 (1999). [23] Z.I.Cabantchik , W.Breuer ,G.Zanninelli and P.Ciancilli, Best. Pract. Res. Clin. Haematol., 18 , 277(2005). [24] C.J.Borman , B.P.Sullivan , C.M . Eggleston and P.J.S . Colberg , Sensors , 9, 4390(2009) [25] A.Tessier,F.Rapin and R.Carignan, Geochim.Cosmochim.Acta.,49,183(1985). [26]H.L.Ehrlich, Geomicrobiology: Marcel Dekker, Inc,: Newyork,NY,USA,1990. [27]M.D.S.Afonso, P.J.Morando, M.A.Blesa , S.Banwart and w.Summ, J. Colloid. Interface. Sci., 138,74(1990). [28]R.Torres,M.A.Blesa and E.Matijevic , J.Colloid.Interface.Sci.,134,475(1990). % Recoveries FDEP 99.1982 99.1982 99.1842 99.1982 % R.S.D FDEP 0.0995 0.0995 0.0796 0.0995 Pharmaceutical SDEP 0.0035 0.0035 0.0035 0.0035 EP SDEP 100.0359 100.0359 100.0359 100.0359 EP 0.0982 0.0988 0.0992 0.0986 SDEP 0.0986 0.0986 0.0986 0.0986 1 2 3 4 Glucofer Ferronin Ferrosam Ferrous sulphate 100.4547 99.8963 98.9186 100.0359 5 10.2130 10.1990 10.2130 0.2130 0.1990 0.2130 102.1302 101.9405 102.1302 0.0966 0.0967 0.0986 6 7 8 0.1222 0.0454 -0.0801 0.1152 0.0175 0.0035 100.9434 100.0359 99.4776 101.2226 100.4547 99.1982 101.1528 100.1755 100.0359 0.1956 0.0986 0.0992 0.1950 0.0982 0.0995 0.0975 0.0985 0.0986 2186
F. M. AL-Jabri et al ____________________________________________________________________________ J. Chem. Pharm. Res., 2012, 4(4):2180-2187 [29]S.S.Butcher, R.J.Charlson, G.H. Orians and G.V.Wolfe, Global Biogeochemical cycles; Academic Press Limited, London ,Uk,1992. [30]D.A.Brown, B.L.Sherriff, J.A.Sawicki andR.Sparling, Geochim. Cosmochim.Acta, 63,2163 (1999). [31] N.N.Greenwood and A. Earnshaw, Chemistry of the Elements , 2nd Ed .; butter worth –Heiremann : Oxford , Uk ,2002. [32] O. Jagner, L. Renman and S.H.Stefansdottir, Analyt. Chim. Acta., 281 ,305(1993). [33] T.M. Florence , Analyst ,117,551(1992). [34] D. Bodocco, P. Pastore, G. Favaro and C.Macca , Talanta , 72 ,249(2007). [35] C.Schlosser and P.L. Croot, Limnol . Oceanogr .Methods , 6 ,630(2008). [36]U.Hase and K. Yoshimura , Analyst ,117 ,1501(1992). [37] M.Andac , A.Asan and I.A. Isildak, Chem . Papers 63 268 (2009). [38] B.S.A.Andrews ,B.S.Rao , S.Dubey and D.M. Rao , J. Chem. Pharm. Res., 2(6),359(2010). [39] J.E.Andersen , Analyst , 130,385 (2005). [40]A.B. Bowie , E.P. Achterberg, P.N.Sedwick , S.Ueeher and P. J. Worsford, Environ . Sci., Technol., 36, 4600(2002). [41] P.l.Croot and P.laan , Analyt . Chim . acta., 466,261(2002). [42] J.T.M.dejong ,J. Den Das , U.Bathmann , M.H.C. Stoll ,G. Kattner, R.F.Nolting and H.J.W.de Baar, Anlyt .Chim.Acta., 377,113(1998). [43] D.W.O'Suilivan , A.K.Hanson and D.R. Kester , Mar . Chem., 49,65(1995). [44]W.Qin and Z.J.Zhang , Fresenius J. Anal , Chem., 360 ,130 (1998). [45] A.L. Rose and T.D. Waite , Analyt . Chem.,73,5909(2001). [46] S.J. Ussher, M. Yaqoob, E.P. Achterberg, A.Nabi and P.J. Worsfold , Analyt .Chem., 77,1971(2005). [47]M.B. Gholivand and F.Raheedayat , Electroanalysis ,16,1330(2004). [48]M.B. Gholivand and F. Sharif pour , Talanta, 60 ,707(2003). [49] A.Sil,V.S. Ijeri and A.K.Sirvastava , Sesors and Actuators B, 106 ,648(2005). [50] R.H .Fayadh , M.Sc. Thesis ,"Spectrophotometric and Potentiometric Analysis of some pharmaceuticals ,"University of Basrah (1998). [51] M.A. El-Ries, F.El- Dars , F.M.Abou Attia, A.B.Farag and A.M.Abd El-Hamed, Insight .Pharm .Sci., 2(1) ,1(2012). [52] A.Saber , M.A .El mosallamy.A.A. Amin and H.M.A. Kella , J.of Food and Drug Analysis ,16(2),11(2008). [53] N.M.H. Rizk, S.S. Abbas, F.A. El-Sayed and A. Abo –Baker, Int .J. Electrochem. Sci.,4,396(2009). [54] H.N. Aliya and U.L. Bilyamin, Bioscience. Research. Communication, 22,267(2010). [55] S.K.Mittal,S.K.A.Kumar and H.K.Sharma, E-Journal of Chemistry , 7(3) ,849(2010) [56] J. Raoof, A. Kiani, R. Ojani, F. Sakhavi and A. Hamidi , Int .J. Electrochem.Sci., 6,1760(2011) [57] M. Marie and M.M. Essi, Chalcogenide letters, 8, 103(2011) [58]I. Fatima and S. Mishra, Indo global Journal of pharmaceutical Sciences, 1(4) ,300(2011) [59]O. Galvoic, M. Samardzic ,D.Derezic , D.Modunic- Cacic and M.Sak- Bosnar, Int. J. Electrochem. Sci., 7, 1522(2012) [60] Vogel A.I., A Text Book of Quantitative Inorganic Analysis 4th Edn ., Longmans, London , 360 , 399(1961) 2187