Download
1 / 7
70 likes | 109 Views
Degradation of phenol by microwave irradiation was carried out to study effect of pH, initial phenol concentration<br>and irradiation time. The effects of two different catalysts such as Titanium dioxide (TiO2) and Zinc oxide (ZnO) on<br>phenol degradation was investigated. At pH 7, percentage phenol degradation was 37% and 27% for 50 mg/l and<br>75 mg/l respectively in 90s.In absence of catalyst the experimental data showed steady decreases in percentage<br>degradation as initial phenol concentration increases from 5 mg/l to 100 mg/l. In the presence of catalyst<br>percentage degradation increased from 19% to 44% for same concentration of phenol in 90s. The degradation<br>follows zero order kinetics with rate constant of ko= 0.17225 s-1

E N D
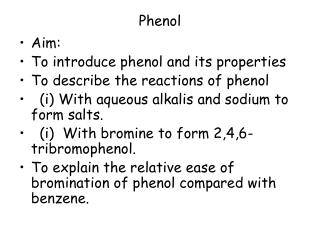
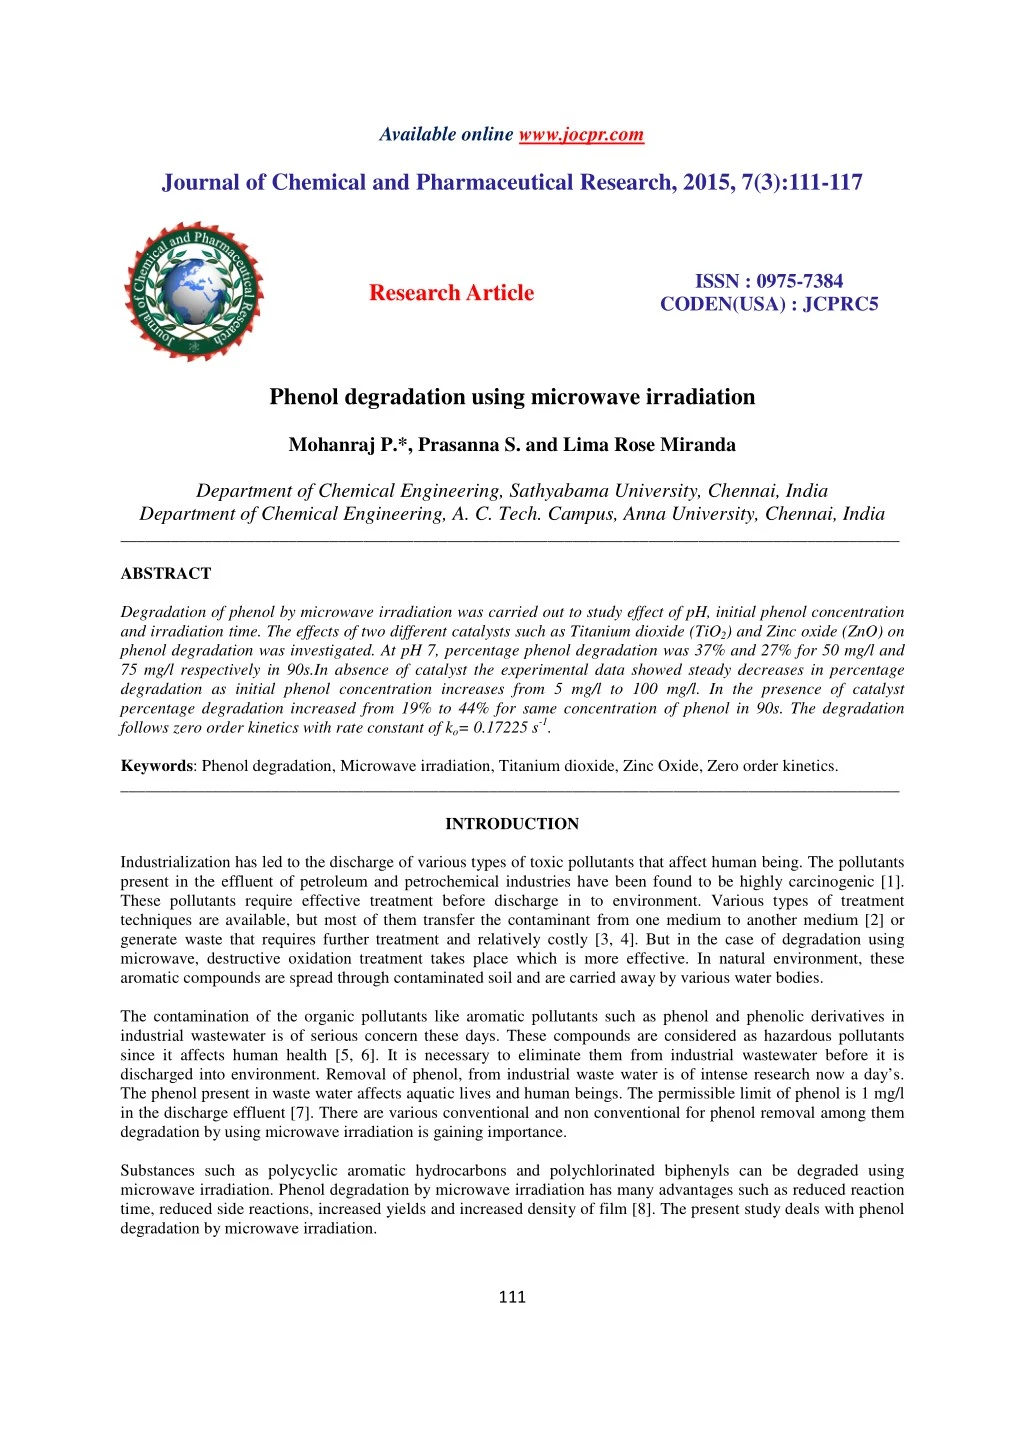
Available online www.jocpr.com Journal of Chemical and Pharmaceutical Research, 2015, 7(3):111-117 ISSN : 0975-7384 CODEN(USA) : JCPRC5 Research Article Phenol degradation using microwave irradiation Mohanraj P.*, Prasanna S. and Lima Rose Miranda Department of Chemical Engineering, Sathyabama University, Chennai, India Department of Chemical Engineering, A. C. Tech. Campus, Anna University, Chennai, India _____________________________________________________________________________________________ ABSTRACT Degradation of phenol by microwave irradiation was carried out to study effect of pH, initial phenol concentration and irradiation time. The effects of two different catalysts such as Titanium dioxide (TiO2) and Zinc oxide (ZnO) on phenol degradation was investigated. At pH 7, percentage phenol degradation was 37% and 27% for 50 mg/l and 75 mg/l respectively in 90s.In absence of catalyst the experimental data showed steady decreases in percentage degradation as initial phenol concentration increases from 5 mg/l to 100 mg/l. In the presence of catalyst percentage degradation increased from 19% to 44% for same concentration of phenol in 90s. The degradation follows zero order kinetics with rate constant of ko= 0.17225 s-1. Keywords: Phenol degradation, Microwave irradiation, Titanium dioxide, Zinc Oxide, Zero order kinetics. _____________________________________________________________________________________________ INTRODUCTION Industrialization has led to the discharge of various types of toxic pollutants that affect human being. The pollutants present in the effluent of petroleum and petrochemical industries have been found to be highly carcinogenic [1]. These pollutants require effective treatment before discharge in to environment. Various types of treatment techniques are available, but most of them transfer the contaminant from one medium to another medium [2] or generate waste that requires further treatment and relatively costly [3, 4]. But in the case of degradation using microwave, destructive oxidation treatment takes place which is more effective. In natural environment, these aromatic compounds are spread through contaminated soil and are carried away by various water bodies. The contamination of the organic pollutants like aromatic pollutants such as phenol and phenolic derivatives in industrial wastewater is of serious concern these days. These compounds are considered as hazardous pollutants since it affects human health [5, 6]. It is necessary to eliminate them from industrial wastewater before it is discharged into environment. Removal of phenol, from industrial waste water is of intense research now a day’s. The phenol present in waste water affects aquatic lives and human beings. The permissible limit of phenol is 1 mg/l in the discharge effluent [7]. There are various conventional and non conventional for phenol removal among them degradation by using microwave irradiation is gaining importance. Substances such as polycyclic aromatic hydrocarbons and polychlorinated biphenyls can be degraded using microwave irradiation. Phenol degradation by microwave irradiation has many advantages such as reduced reaction time, reduced side reactions, increased yields and increased density of film [8]. The present study deals with phenol degradation by microwave irradiation. 111
Mohanraj P. et al ______________________________________________________________________________ J. Chem. Pharm. Res., 2015, 7(3):111-117 EXPERIMENTAL SECTION Chemicals All the chemicals used in the studies were analytical grade purchased from Merk, India. The phenol was purchased from Qualigens and 4-amino antipyrine was purchased from Ranbaxy, India. Degradation experiment Direct microwave degradation was studied in microwave oven (Kenstar model MWO 9811). The phenol was irradiated using non-ionizing radiation with a frequency of 2.45 GHz and a wavelength of 12.5cm for about 90s in the absence of catalyst. Different phenol initial concentrations like 5 mg/l, 10 mg/l, 25 mg/l, 30 mg/l, 40 mg/l, 50 mg/l, 75 mg/l and100 mg/l solutions was prepared and placed in the microwave oven. At regular interval of time 1 ml of the irradiated samples was withdrawn and analysed. Then the percentage of phenol degradation was calculated by using the formula Degradation percentage = ( 100 C Where, C0 & Ct are initial and variable phenol concentration in mg/l Phenol estimation Phenol concentration was determined quantitatively by colorimetric method, using 4- amino antipyrine as colouring reagent. The analyses were performed according to the procedures described in standard method for the estimation of water and waste water [9]. Kinetic studies on phenol degradation The kinetics studies were carried out to determine the order of reaction kinetics. dC k dt On integration, the above equation becomes t C k t C = − + Where, k0 –Zero order kinetic constant in s-1 C0 -initial Concentration in mg/l at time t=0 and Ct - variable Concentration in mg/l at time t=t. RESULTS AND DISCUSSION Effect of time by direct microwave degradation The effect of time on phenol degradation was studied at different time interval with various initial phenol concentrations from 5mg/l to 100mg/l as shown in Figure 1. The pH was maintained at 7. From the experiment it was observed that, as the time of microwave irradiation increases the percentage of degradation of phenol increases. At 90s the maximum value of 100%, 88.7%, 78.7%, 72.03%, 48.32%, 41.61%, 33.54%, 19.51% for 5 mg/l, 10 mg/l, 25 mg/l, 30 mg/l 40 mg/l, 50 mg/l, 75 mg/l and 100 mg/l respectively. As time increases more amount of hydroxyl radicals were formed when electromagnetic waves falls on the phenol solution and decreases the percentage phenol degradation. − ) C C × o t (1) o − = (2) 0 (3) 0 0 112
Mohanraj P. et al ______________________________________________________________________________ J. Chem. Pharm. Res., 2015, 7(3):111-117 Figure 1 Effect of time on microwave degradation of phenol Effect of initial concentration on phenol degradation The effect of initial concentration was analyzed for various initial concentrations ranging from 5mg/l to 100mg/l. The neutral pH was maintained for all phenol concentration. From the experimental data it was found that, as the phenol concentration increases the percentage degradation decreases. At 5 mg/l, 10 mg/l, 25 mg/l, 30 mg/l, 40 mg/l, 50 mg/l, 75 mg/l and 100 mg/l the percentage degradation degreased from 100%, 88.7%, 78.7%, 72.03%, 48.32%, 41.61%, 33.54%, 19.51% respectively as shown in Figure 2. This is due to that intensity of photons emitted by microwave irradiation was constant and is not enough for degrading the higher phenol concentration. Figure 2 Effect of initial phenol concentration on phenol degradation by microwave irradiation Effect of pH pH plays an important role in phenol degradation and generation of hydroxyl radicals [10]. At 50 mg/l and 75mg/l initial phenol concentration the pH was varied from 4 to 10 the maximum degradation was observed at pH 7. For 50 mg/l and 75 mg/l of initial concentration phenol the maximum degradation percentage were 37% and 27 % observed as shown in Figure 3. At highly acidic condition percentage of degradation decreased. The photon emitted produces hydroxyl radicals which form H2O2 which enhances phenol degradation. But at low pH hydroxyl radical reacts with H + ions and forms water which decreases phenol degradation. So pH has strong effect on phenol degradation. 113
Mohanraj P. et al ______________________________________________________________________________ J. Chem. Pharm. Res., 2015, 7(3):111-117 Figure 3 Effect of pH on microwave degradation of phenol Effect of catalyst on phenol degradation The effect of two different catalysts TiO2 and ZnO was studied at 50 mg/l and 100 mg/l of initial phenol concentration. TiO2 has higher degrading capacity at both the levels of phenol concentration when compared to the ZnO as shown in Figure 4. The percentage degradation decreases at higher phenolic concentration. At low concentration perecentage degradation was higher due to surface area available for reaction. Titanium dioxide shows higher degradation than zinc oxide which is due to the availability of an oxygen atom which helps in the oxidative decomposition of phenol solution. Figure 4 Effect of TiO2 and ZnO on phenol degradation at 50 mg/l and 100 mg/l Conformation of phenol degradation using HPLC HPLC was performed to study of phenol degradation during by microwave irradiation. From the Figure 5, Figure 6, Figure 7 and Figure 8 shows the HPLC profile at 0s, 30s, 60s and 90s respectively. It was inferred that the percentage of degradation increases as the time increases since the area under the curve (peak) decreases. The retention time was found to increase when the degradation occurs from 0 sec to 90s. Retention of phenols on a 114
Mohanraj P. et al ______________________________________________________________________________ J. Chem. Pharm. Res., 2015, 7(3):111-117 chromatographic column strongly depends on the pH of the buffer solution in the mobile phase, because of partial dissociation of the molecules of phenols and its derivatives with pH change. The HPLC profile indicates the phenol degradation with respect to time. 0.10 0.10 Detector A - 1 (264nm ) dye1 2.dat Retention Tim e 0.05 0.05 Volts Volts 7.942 8.483 8.175 8.842 3.175 0.00 0.00 0 1 2 3 4 5 6 7 8 9 10 M inutes Figure 5 HPLC profile at 0s on microwave irradiation D etector A - 1 (264nm ) dye1 3.dat R etention Tim e 0.10 0.10 Volts Volts 0.05 0.05 7.992 9.925 3.175 0.00 0.00 0 1 2 3 4 5 6 7 8 9 10 M inutes Figure 6 HPLC profile at 30s on microwave irradiation 0.10 0.10 Detector A - 1 (264nm ) dye1 2.dat Retention Tim e 0.05 0.05 Volts Volts 7.942 8.483 8.175 8.842 3.175 0.00 0.00 0 1 2 3 4 5 6 7 8 9 10 M inutes Figure 7 HPLC profile at 60s on microwave irradiation 115
Mohanraj P. et al ______________________________________________________________________________ J. Chem. Pharm. Res., 2015, 7(3):111-117 Detector A - 1 (264nm ) dye1 1.dat Retention Tim e 0.10 0.10 Volts Volts 0.05 0.05 8.400 9.608 3.283 0.00 0.00 0 1 2 3 4 5 6 7 8 9 10 M inutes Figure 8 HPLC profile at 90s on microwave irradiation Kinetic Studies The kinetics of the phenol degradation was studied to determine the order reaction. The difference in concentration (i.e. initial and variable phenol concentration with time) and time was plotted as shown in Figure 9. The rate constant for zero order kinetics was found to be ko=0.17225 s-1 and also the regression coefficient value of R2=0.9331. Figure 9 Kinetic studies on microwave degradation of phenol. CONCLUSION The experimental data showed decreases in percentage degradation as initial phenol concentration increase from 5mg/l to 100mg/l without any catalyst. In the presence of catalyst percentage degradation increased from 19% to 44% for 100mg/l in 90s. The degradation follows zero order kinetics with rate constant of 0.17225 s-1.The effect of time was directly proportional and the initial concentration was inversely proportional to percentage phenol degradation. TiO2 has more effective than ZnO. From this study microwave irradiation proved to be a potential method for the degradation of organic like phenol pollutant. REFERENCES [1] PR Gogate. Ultrasonics Sonochemistry, 2008, 15, 1–15. 116
Mohanraj P. et al ______________________________________________________________________________ J. Chem. Pharm. Res., 2015, 7(3):111-117 [2] MVV Chandana Lakshmi; V Sridevi; M Narasimha Rao; Swamy Avn. International journal of research in pharmacy and chemistry, 2011, 1(4), 925-935. [3] B Jun Honga; Na Taa; Shao-Gui Yanga; Ya-Zi Liua; Cheng Suna. Desalination, 2007, 1,62-69. [4] Dipty Singh; MH Fulekar. Innovative Romanian Food Biotechnology, 2007, 1, 31-36 [5] JE Begley, DF Ollis. Biochemical Engineering Fundamentals. Mc Graw-Hill, New York,1977. [6] Gautam Sumit Kumar;Rajeev Sharma; AH Ahmad; Indu Shekhar Thakur. World Journal Of Microbiology And Biotechnology, 2003, 19, 73-78. [7] R Satsangee; P Ghosh. Applied Microbiology And Biotechnology, 1990, 34, 127–130. [8] LH Keith. Environ.sci, technol, 1976, 10, 555-564. [9] S. Sivasubramanian; S karthick raja Namasivayam. Indian journal of chemical Technology,2014, 21, 14- 20. [10] Y Anjaneyulu; N chary; D Raj. Rew. Environ. Sci Bio/Technology,2005, 245-273. 117