Download
1 / 6
60 likes | 86 Views
A simple, accurate, sensitive and validated RP-HPLC method for simultaneous determination of Artesunate and Amodiaquine in combined tablet dosage form has been developed. Separation<br>was carried out on Jasco HPLC system equipped with Hypersil Gold C18 (250 × 4.6 mm i.d.) using mobile phase of Acetonitrile and 25 mM potassium dihydrogen phosphate buffer (70:30, v/v) at a flow rate of 1 ml/min using Artemether as internal standard and detection using UV/VIS<br>detector was carried out at 220 nm. Ambient temperature conditions were maintained. Results were linear in the range of 250 – 2000 µg/mL for Artesunate and 10 – 30 µg/mL for<br>Amodiaquine respectively. The method has been successfully applied for the analysis of drugs in<br>pharmaceutical formulation. Results of analysis were validated statistically and by recovery studies. <br>

E N D
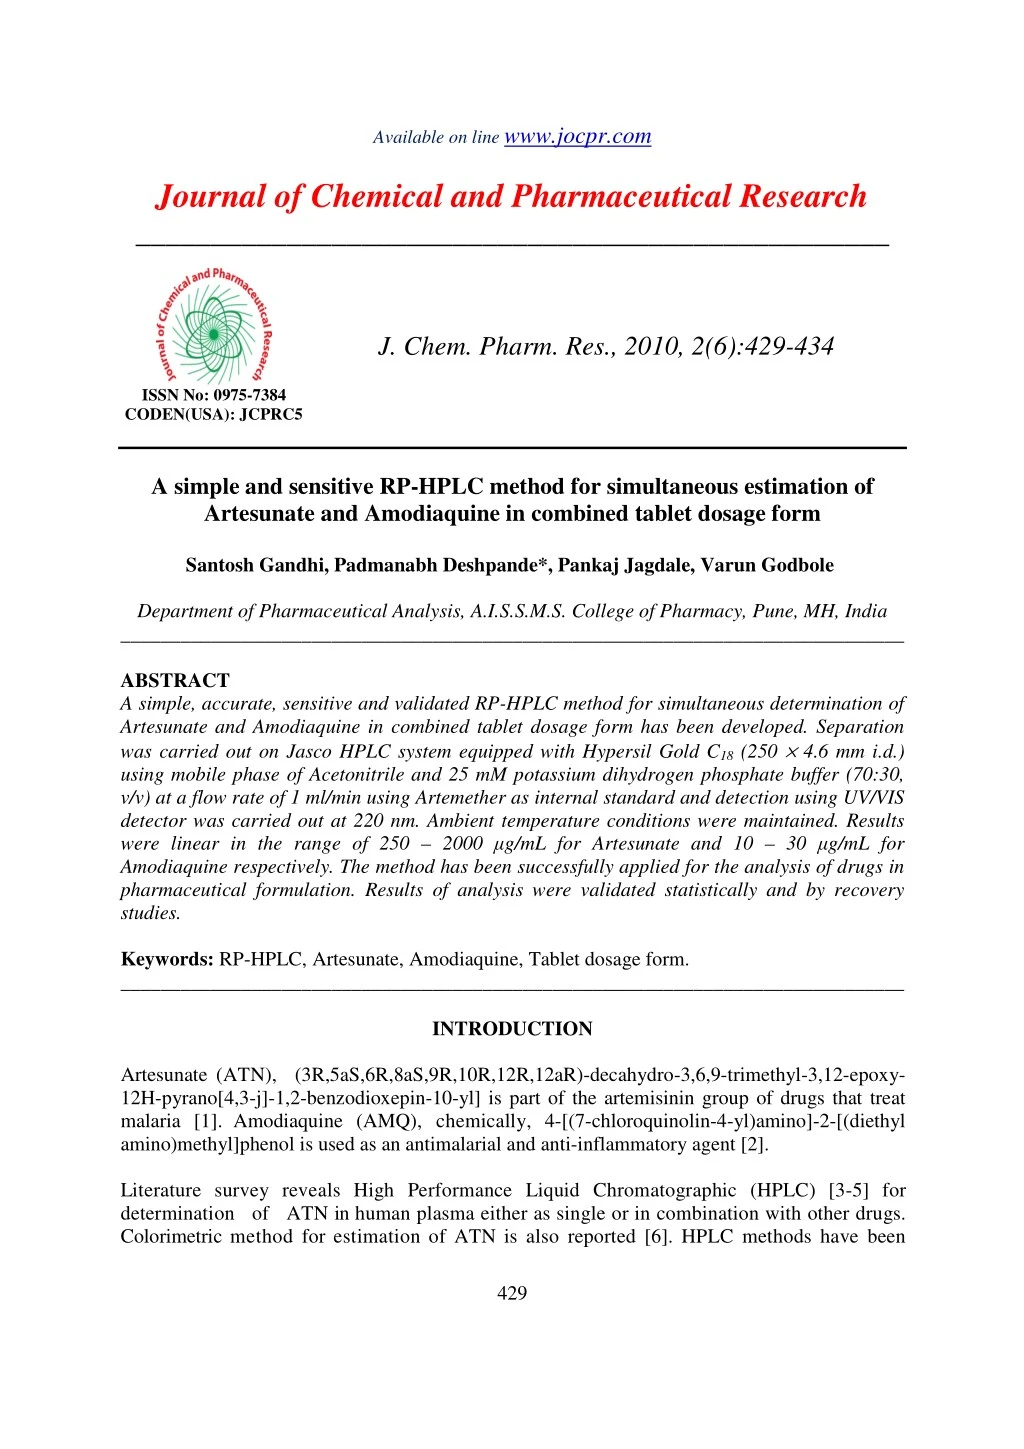
Available on line www.jocpr.com Journal of Chemical and Pharmaceutical Research __________________________________________________ J. Chem. Pharm. Res., 2010, 2(6):429-434 ISSN No: 0975-7384 CODEN(USA): JCPRC5 A simple and sensitive RP-HPLC method for simultaneous estimation of Artesunate and Amodiaquine in combined tablet dosage form Santosh Gandhi, Padmanabh Deshpande*, Pankaj Jagdale, Varun Godbole Department of Pharmaceutical Analysis, A.I.S.S.M.S. College of Pharmacy, Pune, MH, India ______________________________________________________________________________ ABSTRACT A simple, accurate, sensitive and validated RP-HPLC method for simultaneous determination of Artesunate and Amodiaquine in combined tablet dosage form has been developed. Separation was carried out on Jasco HPLC system equipped with Hypersil Gold C18 (250 × 4.6 mm i.d.) using mobile phase of Acetonitrile and 25 mM potassium dihydrogen phosphate buffer (70:30, v/v) at a flow rate of 1 ml/min using Artemether as internal standard and detection using UV/VIS detector was carried out at 220 nm. Ambient temperature conditions were maintained. Results were linear in the range of 250 – 2000 µg/mL forArtesunate and10 – 30 µg/mL for Amodiaquine respectively. The method has been successfully applied for the analysis of drugs in pharmaceutical formulation. Results of analysis were validated statistically and by recovery studies. Keywords: RP-HPLC, Artesunate, Amodiaquine, Tablet dosage form. ______________________________________________________________________________ INTRODUCTION Artesunate (ATN), (3R,5aS,6R,8aS,9R,10R,12R,12aR)-decahydro-3,6,9-trimethyl-3,12-epoxy- 12H-pyrano[4,3-j]-1,2-benzodioxepin-10-yl] is part of the artemisinin group of drugs that treat malaria [1].Amodiaquine (AMQ), chemically, 4-[(7-chloroquinolin-4-yl)amino]-2-[(diethyl amino)methyl]phenol is used as an antimalarial and anti-inflammatory agent [2]. Literature survey reveals High Performance Liquid Chromatographic (HPLC) [3-5] for determination of ATN in human plasma either as single or in combination with other drugs. Colorimetric method for estimation of ATN is also reported [6]. HPLC methods have been 429
Padmanabh Deshpande et al J. Chem. Pharm. Res., 2010, 2(6):429-434 ______________________________________________________________________________ reported for the determination of AMQ either in single or in combination with other drugs [7- 12]. No reports were found for the simultaneous estimation of the ATN and AMQ in combined tablet dosage form by RP-HPLC method. This paper describes a simple, accurate, sensitive and validated RP-HPLC method for simultaneous quantification of these compounds as the bulk drug and in combined tablet dosage forms. The proposed method is optimized and validated as per the International Conference on Harmonization (ICH) guidelines [13]. EXPERIMENTAL SECTION Chemicals and reagents Working standards of pharmaceutical grade ATN and AMQ were obtained as generous gifts from Emcure Pharmaceuticals Ltd. (Pune, India) used as such without further purification. The pharmaceutical dosage form used in this study was Falcigo tablets labeled to contain 50 mg of ATN and 150 mg of AMO were procured from the local market. Acetonitrile (HPLC grade), Potassium dihydrogen phosphate (AR grade) purchased from Merck specialties Pvt. Ltd. (Mumbai, India) and double distilled water were used in analysis. Instrumentationand chromatographic conditions Jasco HPLC system consisting of Jasco PU-2080 plus HPLC pump and UV-2075 plus UV/VIS detector and JASCO Borwin 1.50.8.0 version software was used for analysis. Separation was carried out on Hypersil Gold C18 (250 x 4.6 mm i.d.) column using Acetonitrile: 25 mM Potassium dihydrogen phosphate buffer in ratio of (70:30, v/v) as mobile phase at flow rate of 1.0 ml/min. Samples were injected using Rheodyne injector with 20 µL loop and detection was carried out at 220 nm. All Weighing were done on Shimadzu balance (Model AY-120). Preparation of standard stock solutions Standard stock solutions of ASN and Artemether (ATM) were prepared by dissolving 250 mg of each drug in 50 mL of mobile phase to get concentration of 5 mg/mL. Standard stock solution of AMQ was prepared by dissolving 10 mg of drug in 10 mL of mobile phase to get concentration of 1 mg/mL from which two mililitre of the solution was further diluted to 20 mL with mobile phase to get a working standard solution of concentration 100 µg/mL. Procedure for analysis of tablet formulation Twenty tablets were weighed accurately and a quantity of tablet powder equivalent to 50 mg of ASN and 150 mg of AMQ were weighed separately and transferred to 10 mL volumetric flasks containing about 7 mL of mobile phase, ultrasonicated for 5 min, and volume was made up to the mark with the mobile phase. This solution was filtered through whatman filter paper No. 41. For ASN, 1 mL of filtrate was transferred to 10 mL calibrated volumetric flask, 1 mL stock solution of ATM was added and the volume was made up to the mark with the mobile phase. For AMQ, 0.1 mL of filtrate was further diluted to 10 mL with mobile phase to get solution of concentration 150 µg/mL. One ml of this solution was transferred to 10 mL calibrated volumetric flask, 1 mL stock solution of ATM was added and the volume was made up to the mark with the mobile phase. After setting the chromatographic conditions and stabilizing the instrument to obtain a steady baseline, the tablet sample solutions were injected, chromatogram was obtained and the 430
Padmanabh Deshpande et al J. Chem. Pharm. Res., 2010, 2(6):429-434 ______________________________________________________________________________ peak areas were recorded. The injections were repeated six times and the amount of each drug present per tablet was estimated from the respective calibration curves. Method validation The method was validated for linearity, accuracy, intra-day and inter-day precision and robustness, in accordance with ICH guidelines [13]. Linearity Aliquots 0.5, 1, 2, 3 and 4 mL of stock solution of ASN and 1, 1.5, 2, 2.5, 3 mL working standard solution of AMQ were transferred in a series of 10 mL calibrated volumetric flasks. In each flask, 1 mL stock solution of ATM was added and the volume was made up to the mark with the mobile phase. Five replicates per concentration were injected and chromatograms were recorded. The peak area ratios of ASN to ATM and AMQ to ATM were calculated and respective calibration curves were plotted of response factor against concentration of each drug. Calibration curves for ASN and AMQ were plotted separately of response factor against respective concentration of ASN and AMQ. Precision One set of three different concentrations of mixed standard solutions of ASN and AMQ were prepared. All the solutions were analyzed thrice, in order to record any intra day variations in the results. For Inter day variations study three different concentrations of the mixed standard solutions in linearity range were analyzed on three consecutive days. The peak areas were recorded and Relative standard deviation (RSD) was calculated for both series of analyses. Accuracy To check the accuracy of the method, recovery studies were carried out by addition of standard drug solution to pre-analyzed sample solution at three different levels 50%, 100% and 150%. The percentages of recoveries were calculated, results of which are represented in Table 2. Table 1:Recovery studies of ASN and AMQ Level of % Recovery ASN AMQ 50 101.48 100.06 100 100.67 99.50 150 99.56 98.18 *Avg. of three determinations, R.S.D. is relative standard deviation LOD and LOQ LOD and LOQ were calculated as 3.3 σ /S and 10 σ /S respectively; whereσis the standard deviation of the response (y-intercept) and S is the slope of the calibration plot. Robustness In the robustness study, the influence of small, deliberate variations of the analytical parameters on retention time of the drugs was examined. The following three factors were selected for change: flow rate of the mobile phase (1.0 ± 0.02 ml/min), a wavelength at which the drugs were recorded (220 ± 1 nm) and mobile phase percentage with respect to acetonitrile (± 2 %). One factor at the time was changed to estimate the effect. The solutions containing 500 µg/mLof % Mean Recovery∗ % R.S.D.∗ ASN 1.137 1.126 0.367 Standard Deviation ASN 1.153 1.133 0.393 AMQ 1.492 0.718 1.131 AMQ 1.491 0.721 1.151 431
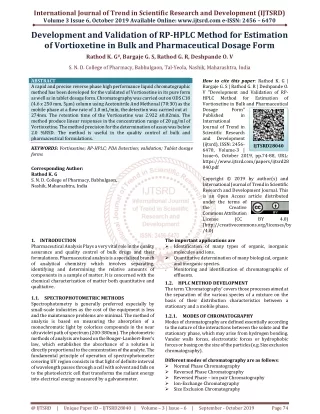
Padmanabh Deshpande et al J. Chem. Pharm. Res., 2010, 2(6):429-434 ______________________________________________________________________________ ASN and 15 µg/mL of AMQ were applied onto the column. A number of replicate analyses (n = 3) were conducted at three levels of the factor (-, 0, +). It was observed that there were no marked changes in the chromatograms, which demonstrated that the RP-HPLC method developed is robust. RESULTS AND DISCUSSION For RP-HPLC method different mobile phases were tried and the mobile phase containing Acetonitrile and 25 mM potassium dihydrogen phosphate buffer (70:30, v/v) was found to be optimal for obtaining well defined and resolved peaks with mean retention times 5.202 min, 2.983 min and 9.275 min for ASN, AMQ and ATM respectively. The representative chromatogram of the standard solution of mixture is shown in Fig. 1. AMQ ASN ATM Fig. 1: Representative chromatogram obtained for standard mixture containing AMQ (15 µ µ µ µg/mL, 2.983 min), ATN (500 µ µ µ µg/mL, 5.202 min) and ATM (500 µ µ µ µg/mL, 9.275 min) Results were found to be linear in the concentration range of 250–2000 µg/mL forATN and10– 30 µg/mL for AMQ. The correlation coefficients for the plots were 0.999 for ATN and 0.997 for AMQ. The proposed method was also evaluated by the assay of commercially available tablets containing ATN and AMQ. The % assay was found to be 100.71 ± 0.542for ATN and 100.46 ± 0.709for AMQ (mean ± S.D., n= 6). The method was found to be accurate and precise, as indicated by recovery studies and % RSD not more than 2. Robustness of the method (data not shown), checked after deliberate alterations of the analytical parameters shown no marked changes in the chromatograms (RSD < 2), which demonstrated that the RP-HPLC method developed is robust. The summary of validation parameters of proposed HPLC method is given in Table 3. 432
Padmanabh Deshpande et al J. Chem. Pharm. Res., 2010, 2(6):429-434 ______________________________________________________________________________ Table 2:Summary of validation parameters of proposed RP-HPLC method Parameters Linearity range (µg/mL) Correlation co-efficient LODa (µg/mL) LOQb (µg/mL) Accuracy (% Recovery) Precision (% RSD)c Intra day (nd = 3) Inter day (n = 3) ATN 250–2000 0.999 87.97 266.57 99.56-101.48 AMQ 10-30 0.997 1.64 4.96 98.18-100.06 0.632 1.06 0.527 1.21 aLOD = Limit of detection. bLOQ =Limit of quantitation. cRSD = Relative standard deviation. dn = Number of determination CONCLUSION The validated RP-HPLC method employed here proved to be simple, fast, accurate, precise and robust, thus can be used for routine analysis of ATN and AMQ in combined tablet dosage form. Acknowledgements The authors express their gratitude to Emcure Pharmaceuticals Ltd. (Pune, India) for the gift sample of pure ATN and AMQ. Thanks are also extended to Dr. (Mrs.) A. R. Madgulkar, Principal, A.I.S.S.M.S. College of Pharmacy for providing necessary facilities and her constant support. REFERENCES [1]http://en.wikipedia.org/wiki/Artesunate accessed on Dec 2010. [2]http://en.wikipedia.org/wiki/Amodiaquine accessed on Dec 2010. [3]R.B. Taylor; M.I. Awad; R.G. Reid; R.R. Moody. J. Chromatogr. B, 2000, 744, 415-421. [4]N. Lindegardh; A. M. Dondorp; P. Singhasivanon; N. J. White; N. P. J. Day. J. Pharm. Biomed. Anal., 2007, 45, 149-153. [5]H. Naik; D. J. Murry; L. E. Kirsch; L. Fleckenstein. J. Chromatogr. B, 2005, 816, 233-242. [6]M. D. Green; D. L. Mount; R. A. Wirtz; N. J. White. J. Pharm. Biomed. Anal., 2000, 24, 65- 70. [7]D. Blessborn; G. Neamin; Y. Bergqvist; N. Lindegardh. J. Pharm. Biomed. Anal., 2006, 41, 207-212. [8]V. K. Dua; N. C. Gupta; V. P. Sharma; S. K. Subbarao. J. Chromatogr. B, 2004, 803, 371- 374. [9]L. Lugimbana; H. M. Malebo; M. D. Segeja; J. A. Akida; L. N. Malle. Tanzan Health Res. Bull.2006, 8, 149-154. [10]O. M. S. Minzi; M. Rais; J. O. Svensson; L. L. Gustafsson; O. Ericsson. J. Chromatogr. B, 2003, 783, 473-480. [11]E. N. Gitau; S. N. Muchohi; B. R. Ogutu; I. M. Githiga; G. O. Kokwaro. J. Chromatogr. B, 2004, 799, 173-177. 433
Padmanabh Deshpande et al J. Chem. Pharm. Res., 2010, 2(6):429-434 ______________________________________________________________________________ [12]D. J. Bell; S. K. Nyirongo; M. E Molyneux; P. A. Winstanley; S. A. Ward. J. Chromatogr. B, 2007, 847, 231-236. [13]ICH Harmonised Tripartite Guideline (Nov. 2005) Validation of Analytical Procedures: Text and Methodology Q2 (R1). 434