Download

1 / 15
180 likes | 663 Views
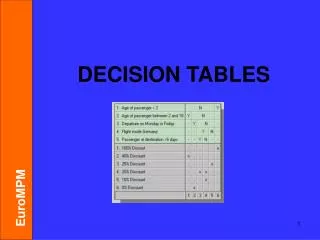
Decision Tables. A useful testing technique and more…. Marien de Wilde, Solution Architect. Definition Application areas Steps to create a decision table Exercise Solution to exercise. In this session …. Definition. Components

E N D
Decision Tables A useful testing technique and more… Marien de Wilde, Solution Architect
Definition Application areas Steps to create a decision table Exercise Solution to exercise In this session …
Definition • Components • A decision table lists causes and effects in a matrix. Each column represents a unique combination. • Purpose is to structure logic Cause = conditionEffect = action = expected results
Application Areas • Business Analysis • Programming • Testing • Hardware Design • etc
Steps to Create a decision table • List all causes in the decision table • Calculate the number of possible combinations • Fill columns with all possible combinations • Reduce test combinations • Check covered combinations • Add effects to the table
Step 1: List all causes Hints: • Write down the values the cause/condition can assume • Cluster related causes • Put the most dominating cause first • Put multi valued causes last
Step 2: Calculate combinations • If all causes are simply Y/N values:2number of causes • If 1 cause with 3 values and 3 with 2:31 * 23 = 24 • Or, use the Values column and multiply each value down the column, eg. 3*2*2*2=24 Number of Values to the power of the number of causes with these values
Step 3: Fill columns • Algorithm: • Determine Repeating Factor (RF): divide remaining combinations by the number of possible values for that cause • Write RF times the first value, then RF times the next etc. until row is full • Next row, go to 1.
Step 4: Reduce combinations • Find indifferent combinations – place a ‘-’ • Join columns where columns are identical • Tip: ensure the effects are the same
Step 5: Check covered combinations • Checksum • For each column calculate the combinations it represents • A ‘-’ represents as many combinations as the cause has • Multiply for each ‘-’ down the column • Add up total and compare with step 2
Step 6: Add effects to table • Read column by column and determine the effects • One effect can occur in multiple test combinations
Exercise: SpecificationCreate a decision table A mailing is to be sent out to customers. The content of the mailing is about the current level of discounting and potential levels of discounting. The content is different for different types of customers. Customer Types A, B and C get a normal letter except Customer Type C, who get a special letter. Any customer with 2 or more current lines or with a credit rating of ‘X’ get a special paragraph added with an offer to subscribe to another level of discounting.
Exercise: possible solution “2 or more current lines OR credit rating X”. What if both: AND? Other customer types? See “O-Other” above. What about non current lines?