Download
1 / 311
3.16k likes | 3.94k Views
Health Consequences of Environmental Degradation and Social Injustice. Martin Donohoe, M.D., F.A.C.P. Am I Stoned?. A 1999 Utah anti-drug pamphlet warns:

E N D
Health Consequences of Environmental Degradation and Social Injustice Martin Donohoe, M.D., F.A.C.P.
Am I Stoned? A 1999 Utah anti-drug pamphlet warns: “Danger signs that your child may be smoking marijuana include excessive preoccupation with social causes, race relations, and environmental issues”
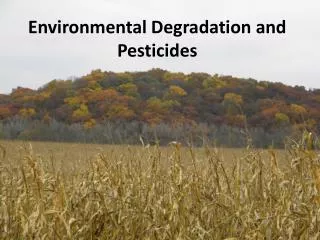
Causes of Environmental Degradation • Overpopulation • Pollution • Deforestation • Global Warming • Agricultural/Fishing Practices • Overconsumption / Affluenza • Militarization
Causes of Environmental Degradation • Maldistribution of Wealth • National and Global Political and Economic Institutions • Poor education • Media manipulation and inaccurate reporting • Unbalanced political influence • Citizen apathy
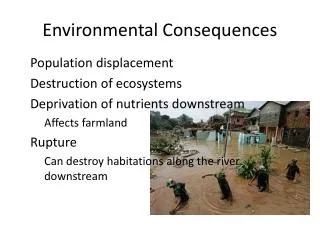
Consequences of Environmental Degradation • Increased poverty and overcrowding • Famine • Weather extremes • Species loss
Consequences of Environmental Degradation • Medical illnesses • Infectious diseases • War • Malthusian chaos and disaster • Tragedy of the Commons
Economic Costs of Environmental Diseases • Estimated at $132-165 billion/year in the U.S. alone • Does not count the psychological and emotional costs of the human suffering involved for the victims, their families, and their communities
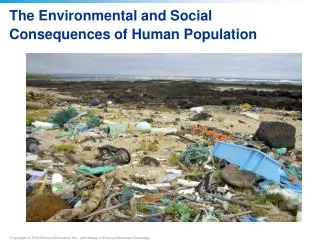
Overpopulation • World population - exponential growth • 1 billion in 1800 • 2.5 billion in 1950 • 6 billion in 2000 • 6.5 billion in 2006 • est. 8 billion by 2050 • More people added to the planet in the last 40 years than in all previous recorded history
Overpopulation • Africa, Asia, and Latin America primarily affected • Causes: • Poverty • Women’s rights issues
Overpopulation • Urbanization • 20-30 million people/year leave rural for urban areas • 2007: first time in history that more than half the world’s population will live in urban areas • World migrant population = 100 million -economic, war and environmental refugees
Urban Sprawl • Since the 1960’s America’s metropolitan areas have been consuming land at a rate 4x faster that population growth
Wallace Stegner “We simply need … wild country available to us, even if we never do more than drive to its edge and look in. For it can be a means of reassuring ourselves of our sanity as creatures, a part of the geography of hope”
Air Pollution • Top ten most polluted cities in the world are in China and India • Most polluted areas in US: • 2001 – LA • 2002 – Houston • 2003 – San Joaquin Valley in Central California • 2004, 2006 – LA
Health Effects of Air Pollution • Causes approximately 75,000 premature deaths/yr. in U.S. • 1.8 million worldwide
Health Effects of Air Pollution • Air pollution causes asthma and impairs lung development and function • Deaths from cardiopulmonary diseases correlate with air pollution levels in US cities • Both day to day and over time
Health Effects of Air Pollution • Increased admissions for CHF, asthma, COPD, PVD, and cerebrovascular disease • Increased lung cancer mortality • Decreased exercise tolerance, increased pulmonary symptoms • Impaired sperm production
Effects of Ozone Destruction • Ozone hole over Antarctic (2½X size of Europe) • Increased cataracts (UV damage) • Increased lifetime melanoma risk • 1/1500 - 1930 • 1/68 - today
Automobiles • Number of autos-US: 1 car/2 people-Mexico: 1/8-China: 1/100 (increasing; leaded gasoline) • Global auto population to double in 25-50 years
Automobiles • Average miles traveled/car/year in U.S. • 1965 - 4,570 mi. • 1975 - 6,150 mi. • 1985 - 7,460 mi. • 1995 - 9,220 mi. • 2006 – 12,000 mi.
Automobiles • Average fuel efficiency of U.S. autos stagnant • Relatively low oil prices • Growing market for low-efficiency pickups, minivans, and sport-utility vehicles • Ford Model T – 25 mpg (1908); Avg. Ford vehicle – 22.6 mpg (2003)
Automobiles: Alternatives • Rapid transit-industry squashed in 1930’s and 40’s (GM, Standard Oil, Firestone, etc.)-Convicted under Sherman Antitrust Act
Automobiles: Alternatives • Car sharing • Pay-as-you-drive auto insurance • “Peak Pricing” and “Congestion Fees” • E.g., London → 30% decrease in traffic, 37% increase in bus ridership, cleaner air • Bicycles/walking • 30% of all trips by bike in Amsterdam; 2% in Portland, OR
Alternatives to Automobiles • Busses • Trains • 15 x more efficient per passenger than autos • Amtrak receives 1/3 the amount of federal funding (adjusted for inflation) that it received 20 years ago
Automobiles: Alternatives • Electric cars-killed by oil companies, automakers in early 20th century • Natural gas, gasohol, and biodiesel • Telecommuting
Automobiles: Alternatives • Solar cars • Hydrogen-powered cars • Byproduct = water • Problem: Hydrogen production requires fossil fuels
US Energy Consumption by Fuel • Oil – 40% • Gas – 25% • Coal – 25% • Nuclear – 9% • Hydroelectric – 1% • Other Renewables – 1.5%
U.S. Energy Sources for Electricity • Coal – 52% • Nuclear – 20% • Gas – 16% • Hydroelectric – 7% • Oil – 3% • Renewables – 2%
Energy Spending/Research • Since 1947, the U.S. has spent $145 billion on nuclear R and D vs. $5 billion on renewables R and D • BP invests $100 million annually in clean energy = amt. it spends annually to market its new name and environmentally-friendly image of moving “Beyond Petroleum”
Petroleum Industry Profits • Mergers squelch competition, drive up prices • Record-breaking oil company profits in 2005 and 2006 • Exxon: $36 billion in 2005 • Largest in U.S. history • Exceeds GDP of 2/3 of world’s nations
Oil and War • Countries that export oil are >40 times more likely to be engaged in civil war than those that do not • Gulf Wars I and II • The Future?
Other Sources of Air Pollution • Industry - #1 • Indoor combustion of coal and biomass (wood, charcoal, crop residues, and animal dung) for cooking, heating and food preservation • Used by almost 3 billion people worldwide • Associated with multiple pulmonary conditions
Garbage • 98% of the country’s total refuse is industrial waste; 2% municipal waste • Making 1 lb of sellable product generates avg. 32 lbs. of waste
Garbage • American produce 4.4 lbs/d garbage • In a lifetime, the average American will throw away 6500 times his/her adult weight in garbage
U.S. Garbage Composition • Paper and Paperboard - 39% • Yard Waste - 13% • Food Waste - 10% • Plastics - 10% • Metals - 8% • Glass - 6% • Wood - 5%
U.S. Recycling Rates • Tires - 22% • Plastic containers - 36% • Glass containers - 28% • Yard waste - 41% • Paper and Paperboard - 42% • Aluminum packaging - 54% • Steel cans - 60% • Auto batteries - 93%
Garbage • Landfills • Incinerators • Garbage Exports
Toxins • 6 trillion tons of over 85,000 chemicals produced annually • 2000-3000 new chemicals registered each year • more than 80% have never been screened for toxicity
Toxic Pollutants • The chemical industry is a $450 billion enterprise in the U.S. alone • Chemical manufacturers are not required to prove safety • the legal burden is on the government to prove that a product is dangerous
Pesticides • 4.5 billion lbs/yr pesticides (17 lbs/citizen) • CA and NY are the only states currently tracking pesticide sales and use