Download
1 / 39
400 likes | 717 Views
PREDICTION OF THE BEACH PROFILE OF HIGH DENSITY THICKENED TAILINGS FROM RHEOLOGICAL AND SMALL SCALE TRIAL DEPOSITION DATA. Gordon McPhail. Introduction. Several approaches to beach prediction: Classical hydrodynamics Empirical Stream Power This paper focuses on the stream power approach.

E N D
PREDICTION OF THE BEACH PROFILE OF HIGH DENSITY THICKENED TAILINGS FROM RHEOLOGICAL AND SMALL SCALE TRIAL DEPOSITION DATA Gordon McPhail
Introduction • Several approaches to beach prediction: • Classical hydrodynamics • Empirical • Stream Power • This paper focuses on the stream power approach
Basis of the stream power approach • Particles need energy to remain in suspension • The energy per unit time consumed by particles in remaining in suspension is stream power • At any point along the beach the stream power is a constant if: • The flow rate is constant • The density is constant
First, some equations • Stream power is calculated from • In a loose boundary situation the stream power at a distance x is given by:
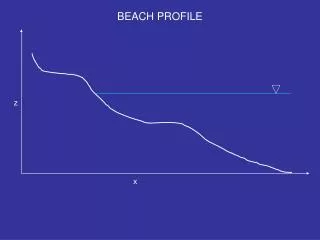
Some logic • The beach will be parallel to the energy line • If we can estimate the slope of the energy line at any point along the beach we can get the beach slope • If we aggregate the slope we get the profile • For a constant flow rate the slope of the stream power curve will be the slope of the energy line
EEK! Entropy • Entropy is a measure of randomness or probabilistic uncertainty of a variable. • All probability distributions may be derived through an entropy-based approach • A great number of natural pheonomena may be described using entropy • Maximisation/minimisation of entropy guarantees minimum bias.
EEK! Entropy • Applied to stream power it means that of all the ways stream power can reduce with distance along the beach there is one that is most probable • McPhail demonstrated that entropy applied to stream power yields good predictions of the beach profile – for conventional tails
So… • Will entropy-stream power work for high density thickened tails? • How could it be applied?
Some more equations • Applying entropy maximisation to stream power yields the following equation: • Differentiating gives the slope at any point on the beach:
Some more equations • The elevation of the beach, y, above the datum is given by: • The slope at the start of the beach is given by
Information needed • The elevation of the beach at the start of the beach profile • The length of the beach • Slurry density • Slurry flow rate • An estimate of the stream power at the start of the beach • An estimate of the initial slope of the beach.
Stream power at the start of the beach • Not equal to the stream power in the pipe • Determined by the plunge pool formed when the slurry strikes the beach
Plunge pool Trajectory Plunge Pool
Plunge pool calculations • Standard hydraulics calculations for hydraulic jumps using specific energy and change in momentum • Energy loss highly dependent on: • Flow rate • Velocity head at end of pipe • Height of pipe above beach • Slurry density
Need friction flow characteristics of the slurry Establish these from rheological testing Estimation of the initial slope of the beach
Homogeneous non-settling slurry rheogram Shear stress Increasing slurry density Shear rate
Non-homogeneous settling slurry • Standard lab viscosity testing on a settling slurry yields spurious results due to settling out in the viscometer at low shear rates • Most hard rock mining tailings produce non-homogeneous, settling slurries • Beaching occurs at low shear rates
Enter flume and small scale deposition testing • Able to simulate deposition • Relatively easy to vary density • Problem - scaling up to full scale
Small scale testing as a rheometer • Use stream power to fit beach profile and calibrate P0 the stream power at the lip of the plunge pool by varying μ • Confirm this using plunge pool calculations • Calculate the velocity at the lip of the plunge pool using: • Calculate the shear rate of the slurry at the lip of the plunge pool using:
Last of the equations • Calculate the fanning friction coefficient using: • Calculate the shear stress in the slurry at the lip of the plunge pool using:
Plot results Shear stress Increasing slurry density Shear rate
Scale up to full scale • Apply plunge pool calculations to determine P0 and the shear rate • Calculate μ • Determine the shear stress • From this calculate f • Calculate the initial slope of the beach • Predict the beach profile for a given beach length
Case study 1 • Solids SG 3.6, hard rock tailings • Max particle dia: 1.18mm • 50% passing 75μ • Flume 7m long, 0.5m wide • 25mm dia discharge pipe • 0.8 l/s
Observations • Good fits of beach profiles for • wide range of % solids, and • between flume and full scale • Both figures are rheograms • Both mirror the rise in shear stress as the shear rate decreases and settling occurs
More observations • In this case the flume shear rates are significantly higher than the full scale • More reliable predictions if shear rate in flume were close to that in the full scale.
Case study 2 • SG solids 2.7, hard rock tailings • Max particle dia: 3.35mm • 15.5% passing 75μ • 12m by 12 m paddocks • One sloping downwards, one upwards • Two slurry concentrations: • 74% solids (1.8t/m3) • 78% solids (1.9t/m3)
Prediction for full scale operation • Slurry density 1.8t/m3 (74% solids) • P0 = 19.7 Watts, shear rate 6.3s-1 • From rheogram, shear stress = 201kPa • Calculate: • Friction slope at lip of plunge pool = 0.031 • Average beach slope over 500m = 1:26 (3.9%)
Conclusions • Entropy stream power handles: • Conventional and high density • Flume and full scale • For homogeneous, non-settling slurries lab-derived rheograms are acceptable • For non-homogeneous, settling slurries use small scale trials which are effectively viscometers • Small scale trials allow a range of slurry densities to be evaluated • Reliability improves if the tests are set such that the shear rate is close to full scale • Predictions are plausible
Finally, in a nutshell • The entropy-stream power approach is versatile in predicting full scale beaching profiles from lab and small scale testing • The only data required is: • The rheogram of the slurry • The full scale pipe size • Discharge conditions • Slurry density • Flow rate • Beach length