Download
1 / 49
490 likes | 680 Views
Extracting insight from large networks: implications of small-scale and large-scale structure. Michael W. Mahoney Stanford University ( For more info, see: http:// cs.stanford.edu/people/mmahoney/ or Google on “Michael Mahoney”). Start with the Conclusions.

E N D
Extracting insight from large networks: implications of small-scale and large-scale structure Michael W. Mahoney Stanford University ( For more info, see: http:// cs.stanford.edu/people/mmahoney/ or Google on “Michael Mahoney”)
Start with the Conclusions • Common (usually implicitly-accepted) picture: • “As graphs corresponding to complex networks become bigger, the complexity of their internal organization increases.” • Empirically, this picture is false. • Empirical evidence is extremely strong ... • ... and its falsity is “obvious,” if you really believe common small-world and preferential attachment models • Very significant implications for data analysis on graphs • Common ML and DA tools make strong local-global assumptions ... • ... that are the opposite of the “local structure on global noise” that the data exhibit
Implications for understanding networks Diffusions appear (under the hood) in many guises (viral marketing, controlling epidemics, query refinement, etc) • low-dim = clustering = implicit capacity control and slow mixing; high-dim doesn’t since “everyone is close to everyone” • diffusive processes very different if deepest cuts are small versus large Recursive algorithms that run one or (n) steps not so useful • E.g. if with recursive partitioning you nibble off 102 (out of 106) nodes per iteration People find lack of few large clusters unpalatable/noninterpretable and difficult to deal with statistically/algorithmically • but that’s the way the data are …
Lots of “networked data” out there! • Technological and communication networks • AS, power-grid, road networks • Biological and genetic networks • food-web, protein networks • Social and information networks • collaboration networks, friendships; co-citation, blog cross-postings, advertiser-bidded phrase graphs ... • Financial and economic networks • encoding purchase information, financial transactions, etc. • Language networks • semantic networks ... • Data-derived “similarity networks” • recently popular in, e.g., “manifold” learning • ...
Sponsored (“paid”) SearchText-based ads driven by user query
Sponsored Search Problems Keyword-advertiser graph: • provide new ads • maximize CTR, RPS, advertiser ROI • Motivating cluster-related problems: • Marketplace depth broadening: • find new advertisers for a particular query/submarket • Query recommender system: • suggest to advertisers new queries that have high probability of clicks • Contextual query broadening: • broaden the user's query using other context information
Micro-markets in sponsored search Goal: Find isolated markets/clusters (in an advertiser-bidded phrase bipartite graph) with sufficient money/clicks with sufficient coherence. Ques: Is this even possible? What is the CTR and advertiser ROI of sports gambling keywords? Movies Media Sports Sport videos Gambling 1.4 Million Advertisers Sports Gambling 10 million keywords
How people think about networks • “Interaction graph” model of networks: • Nodes represent “entities” • Edges represent “interaction” between pairs of entities • Graphs are combinatorial, not obviously-geometric • Strength: powerful framework for analyzing algorithmic complexity • Drawback: geometry used for learning and statistical inference
How people think about networks Some evidence for micro-markets in sponsored search? A schematic illustration … query … of hierarchical clusters? advertiser
These graphs have “nice geometric structure” (in the sense of having some sort of low-dimensional Euclidean structure)
These graphs do not ... (but they may have other/more-subtle structure that low-dim Euclidean)
Local “structure” and global “noise” Many (most, all?) large informatics graphs • have local structure that is meaningfully geometric/low-dimensional • does not have analogous meaningful global structure
Local “structure” and global “noise” Many (most, all?) large informatics graphs • have local structure that is meaningfully geometric/low-dimensional • does not have analogous meaningful global structure Intuitive example: • What does the graph of you and your 102 closest Facebook friends “look like”? • What does the graph of you and your 105 closest Facebook friends “look like”?
Questions of interest ... What are degree distributions, clustering coefficients, diameters, etc.? Heavy-tailed, small-world, expander, geometry+rewiring, local-global decompositions, ... Are there natural clusters, communities, partitions, etc.? Concept-based clusters, link-based clusters, density-based clusters, ... (e.g., isolated micro-markets with sufficient money/clicks with sufficient coherence) How do networks grow, evolve, respond to perturbations, etc.? Preferential attachment, copying, HOT, shrinking diameters, ... How do dynamic processes - search, diffusion, etc. - behave on networks? Decentralized search, undirected diffusion, cascading epidemics, ... How best to do learning, e.g., classification, regression, ranking, etc.? Information retrieval, machine learning, ...
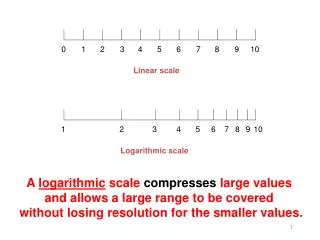
Popular approaches to large network data Heavy-tails and power laws (at large size-scales): • extreme heterogeneity in local environments, e.g., as captured by degree distribution, and relatively unstructured otherwise • basis for preferential attachment models, optimization-based models, power-law random graphs, etc. Local clustering/structure (at small size-scales): • local environments of nodes have structure, e.g., captures with clustering coefficient, that is meaningfully “geometric” • basis for small world models that start with global “geometry” and add random edges to get small diameter and preserve local “geometry”
Graph partitioning A family of combinatorial optimization problems - want to partition a graph’s nodes into two sets s.t.: • Not much edge weight across the cut (cut quality) • Both sides contain a lot of nodes Several standard formulations: • Graph bisection (minimum cut with 50-50 balance) • -balanced bisection (minimum cut with 70-30 balance) • cutsize/min{|A|,|B|}, or cutsize/(|A||B|) (expansion) • cutsize/min{Vol(A),Vol(B)}, or cutsize/(Vol(A)Vol(B)) (conductance or N-Cuts) All of these formalizations of the bi-criterion are NP-hard!
Why worry about both criteria? • Some graphs (e.g., “space-like” graphs, finite element meshes, road networks, random geometric graphs) cut quality and cut balance “work together” • For other classes of graphs (e.g., informatics graphs, as we will see) there is a “tradeoff,” i.e., better cuts lead to worse balance • For still other graphs (e.g., expanders) there are no good cuts of any size
The “lay of the land” Spectral methods* - compute eigenvectors of associated matrices Local improvement - easily get trapped in local minima, but can be used to clean up other cuts Multi-resolution - view (typically space-like graphs) at multiple size scales Flow-based methods* - single-commodity or multi-commodity version of max-flow-min-cut ideas *Comes with strong underlying theory to guide heuristics.
Comparison of “spectral” versus “flow” Spectral: • Compute an eigenvector • “Quadratic” worst-case bounds • Worst-case achieved -- on “long stringy” graphs • Embeds you on a line (or complete graph) Flow: • Compute a LP • O(log n) worst-case bounds • Worst-case achieved -- on expanders • Embeds you in L1 Two methods -- complementary strengths and weaknesses • What we compute will be determined at least as much by as the approximation algorithm we use as by objective function.
Interplay between preexisting versus generated versus implicit geometry Preexisting geometry • Start with geometry and add “stuff” Generated geometry • Generative model leads to structures that are meaningfully-interpretable as geometric Implicitly-imposed geometry • Approximation algorithms implicitly embed the data in a metric/geometric place and then round. (X’,d’) (X,d) y f f(y) d(x,y) f(x) x
“Local” extensions of the vanilla “global” algorithms Cut improvement algorithms • Given an input cut, find a good one nearby or certify that none exists Local algorithms and locally-biased objectives • Run in a time depending on the size of the output and/or are biased toward input seed set of nodes Combining spectral and flow • to take advantage of their complementary strengths To do: apply ideas to other objective functions
Illustration of “local spectral partitioning” on small graphs • Similar results if we do local random walks, truncated PageRank, and heat kernel diffusions. • Often, it finds “worse” quality but “nicer” partitions than flow-improve methods. (Tradeoff we’ll see later.)
An awkward empirical fact Lang (NIPS 2006), Leskovec, Lang, Dasgupta, and Mahoney (WWW 2008 & arXiv 2008) Can we cut “internet graphs” into two pieces that are “nice” and “well-balanced”? For manyreal-world social-and-information “power-law graphs,” there is an inverse relationship between “cut quality” and “cut balance.”
Large Social and Information Networks Leskovec, Lang, Dasgupta, and Mahoney (WWW 2008 & arXiv 2008) Epinions LiveJournal Focus on the red curves (local spectral algorithm) - blue (Metis+Flow), green (Bag of whiskers), and black (randomly rewired network) for consistency and cross-validation.
More large networks Web-Google Cit-Hep-Th Gnutella AtP-DBLP
Widely-studied small social networks Zachary’s karate club Newman’s Network Science
“Low-dimensional” graphs (and expanders) RoadNet-CA d-dimensional meshes
NCPP for common generative models Copying Model Preferential Attachment Geometric PA RB Hierarchical
NCPP: LiveJournal (N=5M, E=43M) Better and better communities Best communities get worse and worse Community score Best community has ≈100 nodes Community size 31
Consequences of this empirical fact Relationship b/w small-scale structure and large-scale structure in social/information networks* is not reproduced (even qualitatively) by popular models • This relationship governs diffusion of information, routing and decentralized search, dynamic properties, etc., etc., etc. • This relationship also governs (implicitly) the applicability of nearly every common data analysis tool in these apps *Probably much more generally--social/information networks are just so messy and counterintuitive that they provide very good methodological test cases.
Popular approaches to network analysis Define simple statistics (clustering coefficient, degree distribution, etc.) and fit simple models • more complex statistics are too algorithmically complex or statistically rich • fitting simple stats often doesn’t capture what you wanted Beyond very simple statistics: • Density, diameter, routing, clustering, communities, … • Popular models often fail egregiously at reproducing more subtle properties (even when fit to simple statistics)
Failings of “traditional” network approaches Three recent examples offailings of “small world” and “heavy tailed” approaches: • Algorithmic decentralized search - solving a (non-ML) problem: can we find short paths? • Diameter and density versus time - simple dynamic property • Clustering and community structure - subtle/complex static property (used in downstream analysis) All three examples have to do with the coupling b/w “local” structure and “global” structure --- solution goes beyond simple statistics of traditional approaches.
How do we know this plot it “correct”? • Algorithmic Result Ensemble of sets returned by different algorithms are very different Spectral vs. flow vs. bag-of-whiskers heuristic • Statistical Result Spectral method implicitly regularizes, gets more meaningful communities • Lower Bound Result Spectral and SDP lower bounds for large partitions • Structural Result Small barely-connected “whiskers” responsible for minimum • Modeling Result Very sparse Erdos-Renyi (or PLRG wth (2,3)) gets imbalanced deep cuts
Regularized and non-regularized communities (1 of 2) Diameter of the cluster Conductance of bounding cut Local Spectral Connected Disconnected External/internal conductance • Metis+MQI (red) gives sets with better conductance. • Local Spectral (blue) gives tighter and more well-rounded sets. Lower is good
Regularized and non-regularized communities (2 of 2) Two ca. 500 node communities from Local Spectral Algorithm: Two ca. 500 node communities from Metis+MQI:
Interpretation: “Whiskers” and the “core” of large informatics graphs NCP plot Slope upward as cut into core Largest whisker • “Whiskers” • maximal sub-graph detached from network by removing a single edge • contains 40% of nodes and 20% of edges • “Core” • the rest of the graph, i.e., the 2-edge-connected core • Global minimum of NCPP is a whisker • BUT, core itself has nested whisker-core structure
What if the “whiskers” are removed? Then the lowest conductance sets - the “best” communities - are “2-whiskers.” (So, the “core” peels apart like an onion.) Epinions LiveJournal
Interpretation: A simple theorem on random graphs Structure of the G(w) model, with (2,3). • Sparsity (coupled with randomness) is the issue, not heavy-tails. • (Power laws with (2,3) give us the appropriate sparsity.) Power-law random graph with (2,3).
Look at (very simple) whiskers Ten largest “whiskers” from CA-cond-mat.
What do the data “look like” (if you squint at them)? A “point”? A “hot dog”? A “tree”? (or clique-like or expander-like structure) (or tree-like hyperbolic structure) (or pancake that embeds well in low dimensions)
Squint at the data graph … Say we want to find a “best fit” of the adjacency matrix to: What does the data “look like”? How big are , , ? • ≈ » low-dimensional • ≈ ≈ expander or Kn • » ≈ bipartite graph • » » core-periphery
Small versus Large Networks Leskovec, et al. (arXiv 2009); Mahdian-Xu 2007 • Small and large networks are very different: (also, an expander) E.g., fit these networks to Stochastic Kronecker Graph with “base” K=[a b; b c]: K1 =
Small versus Large Networks Leskovec, et al. (arXiv 2009); Mahdian-Xu 2007 • Small and large networks are very different: (also, an expander) E.g., fit these networks to Stochastic Kronecker Graph with “base” K=[a b; b c]: K1 =
Implications: high level What is simplest explanation for empirical facts? • Extremely sparse Erdos-Renyi reproduces qualitative NCP (i.e., deep cuts at small size scales and no deep cuts at large size scales) since: sparsity + randomness = measure fails to concentrate • Power law random graphs also reproduces qualitative NCP for analogous reason • Iterative forest-fire model gives mechanism to put local geometry on sparse quasi-random scaffolding to get qualitative property of relatively gradual increase of NCP Data are local-structure on global-noise, not small noise on global structure!
Implications: high level, cont. • Remember the Stochastic Kronecker theorem: • Connected, if b+c>1: 0.55+0.15 > 1. No! • Giant component, if (a+b)_(b+c)>1: (0.99+0.55)_(0.55+0.15) > 1. Yes! • Real graphs are in a region of parameter space analogous to extremely sparse Gnp. • Large vs small cuts, degree variability, eigenvector localization, etc. Gnp p 1/n log(n)/n PLRG 3 2 theory & models real-networks Data are local-structure on global-noise, not small noise on global structure!
Implications for understanding networks Diffusions appear (under the hood) in many guises (viral marketing, controlling epidemics, query refinement, etc) • low-dim = clustering = implicit capacity control and slow mixing; high-dim doesn’t since “everyone is close to everyone” • diffusive processes very different if deepest cuts are small versus large Recursive algorithms that run one or (n) steps not so useful • E.g. if with recursive partitioning you nibble off 102 (out of 106) nodes per iteration People find lack of few large clusters unpalatable/noninterpretable and difficult to deal with statistically/algorithmically • but that’s the way the data are …
Conclusions • Common (usually implicitly-accepted) picture: • “As graphs corresponding to complex networks become bigger, the complexity of their internal organization increases.” • Empirically, this picture is false. • Empirical evidence is extremely strong ... • ... and its falsity is “obvious,” if you really believe common small-world and preferential attachment models • Very significant implications for data analysis on graphs • Common ML and DA tools make strong local-global assumptions ... • ... that are the opposite of the “local structure on global noise” that the data exhibit