Download

1 / 13
140 likes | 428 Views
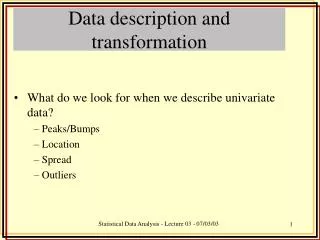
Assumption and Data Transformation. Assumption of Anova. The error terms are randomly, independently, and normally distributed The variance of different samples are homogeneous Variances and means of different samples are not correlated The main effects are additive.

E N D
Assumption of Anova • The error terms are randomly, independently, and normally distributed • The variance of different samples are homogeneous • Variances and means of different samples are not correlated • The main effects are additive
Randomly, independently and Normally distribution • The assumption of normality do not affect the validity of the analysis of variance too seriously • There are test for normality, but it is rather point pointless to apply them unless the number of samples we are dealing with is fairly large • Independence implies that there is no relation between the size of the error terms and the experimental grouping to which the belong • It is important to avoid having all plots receiving a given treatment occupying adjacent positions in the field • The best insurance against seriously violating the first assumption of the analysis of variance is to carry out the randomization appropriate to the particular design
Normally test • Shapiro-Wilk test • Lilliefors-Kolmogorov-Smirnov Test • Graphical methods based on residual error (Residual Plotts)
Homogeneity of Variance • Unequal variances can have a marked effect on the level of the test, especially if smaller sample sizes are associated with groups having larger variances • Unequal variances will lead to bias conclusion
Way to solve the problem of Heterogeneous variances • We can separate the data into groups such that the variances within each group are homogenous • We can use an advance statistic tests rather than analysis of variance • we might be able to transform the data in such a way that they will be homogenous
Homogeneity test of Variance • Hartley F-max test • Bartlett’s test • Residual plot for checking the equal variance assumption
Independence of Means and Variance • It is a special case and the most common cause of heterogeneity of variance • A positive correlation between means and variances is often encountered when there is a wide range of sample means • Data that often show a relation between variances and means are data based on counts and data consisting of proportion or percentages • Transformation data can frequently solve the problems
The Main effects are additive • For each design, there is a mathematical model called a linear additive model. • It means that the value of experimental unit is made up of general mean plus main effects plus an error term • When the effects are not additive, there are multiplicative treatment effect • In the case of multiplication treatment effects, there are again transformation that will change the data to fit the additive model
Data Transformation • There are two ways in which the anova assumptions can be violated: 1. Data may consist of measurement on an ordinal or a nominal scale 2. Data may not satisfy at least one of the four requirements • Two options are available to analyze data: 1. It is recommended to use non-parametric data analysis 2. It is recommended to transform the data before analysis
Logaritmic Transformation • It is used when the standard deviation of samples are roughly proportional to the means • There is an evidence of multiplicative rather than additive • Data with negative values or zero can not be transformed. It is suggested to add 1 before transformation
Square Root Transformation • It is used when we are dealing with counts of rare events • The data tend to follow a Poisson distribution • If there is account less than 10. It is better to add 0.5 to the value
Arcus sinus or angular Transformation • It is used when we are dealing with counts expressed as percentages or proportion of the total sample • Such data generally have a binomial distribution • Such data normally show typical characteristics in which the variances are related to the means