Download
1 / 24
240 likes | 628 Views
http://www.skagit.meas.ncsu.edu/~helena/measwork/panama/panama.html ... Panama Stream Network: r.terraflow. r.watershed: 12 hours for 10m resolution Chagres basin ...

E N D
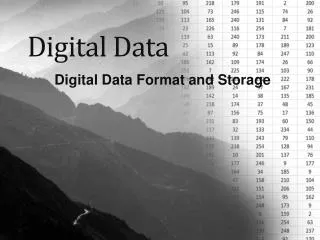
3. Primary digital data
- digitized maps : geology, streams, topography at 1:250,000 scale -Interferometric Synthetic Aperture Radar - Elevation (IFSARE) : 10m resolution DEM -LANDSAT imagery: 30m resolution -GPS-georeferenced locations of field sites, rain gauges and weather stations
4. Data integration
Integration of all available spatial data within a common GIS data base enables the participating researchers to analyze spatial relationships between different landscape phenomena and features and gain new knowledge about the studied landscape interactions. Challenges : different coordinate systems and datums (ll, UTM) different scales - field data to regional scale maps different data models and formats (points, vector raster, shape files to spreadsheets) H. Mitasova
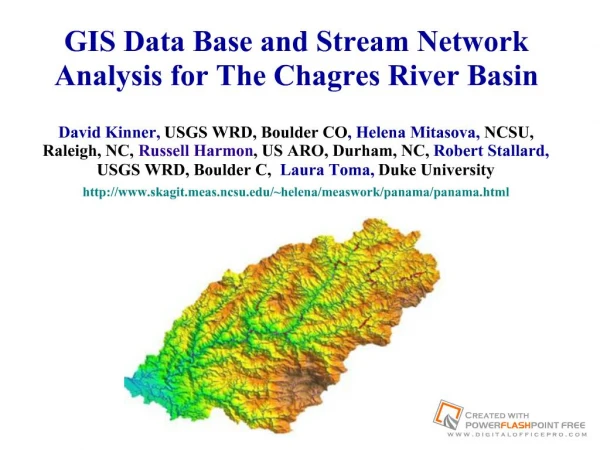
5. Chagres River Basin GIS
Coordinate system: Panama Canal Zone coordinate system (UTM projection, zone 17, and NAS_O datum) Data models and formats: Raster: 10, 25, 30 and 50m resolution used for DEM, stream networks, basins and imagery Vector: geology, streams (old and new), contours Points: field sites, rain gauges, weather stations available in ESRI and GRASS formats all data are clipped to the watershed with 5km buffer Distribution: CDROM, Web site http://skagit.meas.ncsu.edu/~helena/measwork/panama/panama.html
6. Chagres River Basin GIS: elevation
H. Mitasova Derived from IFSARE
H. Mitasova Derived from LANDSAT Chagres River Basin GIS: geology Clipped from 1:250,000 Panama geology map9. Chagres River Basin GIS: field sites
Measured by GPS
10. Basin analysis: parameters
H. Mitasova Basin analysis includes derivation of basin parameters from a DEM based on flow routing. The following map layers and quantitative characteristics were derived: basin and sub-basin boundaries and areas stream networks flow accumulation and flow direction
11. Basin analysis: tools
Basin analysis was performed using the following raster-based tools: RivertoolsTM - a commercially-available terrain analysis system for analyzing DEM-derived river basin characteristics. It has multiple flow direction algorithms,visualization tools and tools for extracting statistical properties of river networks (ie., bifurcation ratio, statistical similarity, fractal dimension, etc.). GRASS GIS - an Open Source/Free software general purpose GIS. It includes a number of modules for basin analysis, r.watershed was used in this work.
12. Basin analysis: methods
The principle behind the D-8 is that water is routed in the flow direction with the greatest slope. The left image shows a hypothetical elevation neighborhood on a DEM. The right shows the corresponding slopes and the routing of water from cell (I,J) to cell (I,J-1). The basic D-8 flow routing algorithm is used by the tools that were applied in the analysis.
Sink filling is used by Rivertools as a precursor to computing flow direction The average filling necessary to route water through the reach in this figure is 7.68 m - this is magnitude larger than the filling typically required for bare earth USGS DEM. H. Mitasova Flow is routed from one end of the flat to the other by iteratively and arbitrarily defining flow direction for each cell (iterative linking; red-line) or by projecting the surrounding topography into the flat area (imposed gradients; blue line).15. Basin analysis: results
Sub-basins and stream network derived at 25m resolution using r.watershed and threshold 62500m2 upslope area
16. Basin analysis: results
Stream networks derived at low resolutions with threshold 100xcell area 100m 200m 300m 400m
17. Basin analysis: results
Stream networks derived at 50m resolution with threshold for stream origin at 100 x cell area: comparison with field data for entire watershed
Stream networks derived at 10m and 25mresolutions : difference between iterative linking and results from r.watershed Rivertools iterative linking r.watershed Stream networks derived at 10m and 25mresolutions : difference between iterative linking and results from r.watershed, 2D map Rivertools iterative linking r.watershed The �flat� area isn't really flat, it was created by DEM filling 3D view of the original DEM with streams derived by Rivertools and field sites Upper Chico study area Lower Chagres: good fit with the field data 10m DEM: black areas are filled Overlayed stream network and field sites Detailed comparison of results : 10m(black line), 25m (colored pixels) resolution and field sites (green points)23. Panama Stream Network: r.terraflow
r.watershed: 12 hours for 10m resolution Chagres basin r.terraflow: 3 hours for 10m resolution entire Panama Flow accumulation using MFD option for central Chagres
Conclusions H. Mitasova In spite of the impact of canopy on the DEM it was possible to derive stream networks consistent with the field data, probably due to significant relief and relatively homogeneous vegetation cover. In steeper areas the results from different algorithms are practically the same, however, there are differences in depressions, flood plain and flat areas, where algorithms that do not perform filling and iterative linking provide better results. Field data are needed for sound selection of threshold defining the stream origin