Download

1 / 38
390 likes | 656 Views
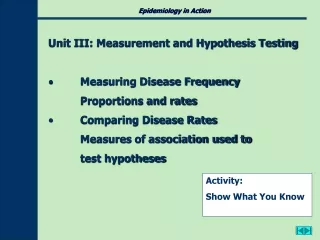
Epidemiology in Action. Unit II. Types of Epidemiology Studies Experimental vs. Observational Descriptive and Analytic Studies. Activities: Study the STATS 2. Name That Study. Epidemiology in Action. 2. Experimental Researchers have control over key variables in the study.

E N D
Epidemiology in Action • Unit II. Types of Epidemiology Studies • Experimental vs. Observational • Descriptive and Analytic Studies • Activities: • Study the STATS • 2. Name That Study
Epidemiology in Action 2 • Experimental • Researchers have control over key variables in the study. • Observational • Researchers do not have control over key variables in the study.
EXPERIMENTAL Studies in which researchers control key variables. These include intervention and clinical trials that attempt to prove cause and effect. Epidemiology in Action 3 Vaccine trials, for example. One population receives the vaccine (an independent variable that the researchers control), the other doesn’t (or is given a placebo to “blind” subjects) and serves as the control group. The groups are compared in terms of how well/if the vaccine works. Source: CDC/1963 Health workers administering the polio vaccine to children.
Epidemiology in Action 4 EXPERIMENTAL This is a hypothetical example of a study where one group of juveniles recovering from substance abuse is treated through in-house drug treatment while the other is not. Study tracks rate of relapse over time. Total # who relapsed Months After Treatment
Epidemiology in Action 5 • EXPERIMENTAL • Advantages • Gold standard for proving causation, because you control the variables you’re studying • Risk factors can be isolated • Disadvantages • Can be difficult to isolate variables • Ethical issues
Epidemiology in Action 6 OBSERVATIONAL STUDIES: DESCRIPTIVE Studies which describe the FREQUENCY and PATTERNS of occurrence of a condition or factor by time, place, and person – for example, these studies on exercise by U.S. state. Link:Behavioral Risk Factor Surveillance System CDC SOURCE: Centers for Disease Control and Prevention (CDC). Behavioral Risk Factor Surveillance System Survey Data. Atlanta: CDC/U.S. Department of Health and Human Services, 2000.
Epidemiology in Action 7 • DESCRIPTIVE • Advantages • Can be conducted using widely available data • Can be conducted on large populations • Disadvantages • Difficult to infer causation • Can be expensive and time-consuming • Susceptible to bias (surveys, for example)
DESCRIPTIVE Studies are used to characterize a health problem and its risk factors. These studies also COMPARE groups of people in terms of changes in health conditions over time, place, and exposure to risk factors. Epidemiology in Action 8 For example, many organizations keep ongoing statistics on teen pregnancy. They may DESCRIBE the health status (pregnancy) of teen females, and/or COMPARE the RATE of pregnancy for POPULATIONS ( a 1975 group to a 1985 group). They may compare rates to RISK FACTORS (race/ethnicity, socio-economic status, etc.) Link: Teen Pregnancy.org
Epidemiology in Action 9 A study like the one at right DESCRIBES the health status of a population. Link: Teen Pregnancy.org
10 Number of Teen Pregnancies, 1996 (AGI) Nearly 1 million teen pregnancies occurred in 1996. To put it another way, more than 100 U.S. teens become pregnant each hour. Forty percent of these pregnancies were to girls under age 18, and 60 percent were to girls aged 18-19. Total: 905,000 542,640 337,530 24,830 The Alan Guttmacher Institute. (1999). Special report: U.S. teenage pregnancy statistics with comparative statistics for women aged 20-24. New York: Author. Link: The Alan Guttmacher Institute: Home Page This study DESCRIBES and COMPARES rates by age.
11 Teen Pregnancy Rates, Girls Aged 15-17 (AGI)(number of pregnancies per 1,000 girls) After increasing 19 percent between 1972 and 1989 (including 7 percent between 1986 and 1989), the teen pregnancy rate for girls aged 15-17 decreased 17 percent between 1989 and 1996 to its lowest rate ever recorded. Link: Teen Pregnancy.org The Alan Guttmacher Institute. (1999). Special report: U.S. teenage pregnancy statistics with comparative statistics for women aged 20-24. New York: Author. Link: The Alan Guttmacher Institute: Home Page This study COMPARES two populations, girls/1972 to girls/1996.
Number of teen births, 1999* 12 Among teens aged 15-19, more births occur to non-Hispanic White teens than to any other racial/ethnic group. * Data for 1999 are preliminary. Curtin, S.C., & Martin, J.A. (2000). Births: Preliminary data for 1999. National Vital Statistics Reports 48(14). Link: Teen Pregnancy.org This study COMPARES rates to the RISK FACTOR of Race/Ethnicity.
13 Teen Pregnancy Rates, Racial/Ethnic Subgroups (AGI)(number of pregnancies per 1,000 girls aged 15-19) Teen pregnancy rates vary substantially among the three largest racial/ethnic subgroups. Between 1990 and 1996, the rate for African-American teens declined 20 percent and the rate for non-Hispanic White teens declined 24 percent. The teen pregnancy rate for Hispanics increased between 1990 and 1994, but then declined 6 percent between 1994 and 1996. Non-Hispanic Black Hispanic (any race) Non-Hispanic White Darroch, J.E., & Singh, S. (1999). Why is teenage pregnancy declining? The roles of abstinence, sexual activity and contraceptive use. Occasional Report 1. New York: The Alan Guttmacher Institute. Link: The Alan Guttmacher Institute: Home Page This study COMPARES rates, in terms of race/ethnicity, and over time.
14 • You may have noticed that data on teen pregnancy can be presented in many different ways. When INTERPRETING results from studies, it is important to pay attention to these details. For example: • WHAT is the study measuring, in terms of • AGE • TIME • GEOGRAPHY • RISK FACTORS? • WHERE did the data come from? • Who collected it, and how was it collected? • The data on the next three screens is similar, but comes from different sources and tracks different years and ages. Link: Teen Pregnancy.org Link:The Alan Guttmacher Institute: Home Page
15 Teen Pregnancy Rates, Girls Under 15 (AGI)(number of pregnancies per 1,000 girls) After increasing 30 percent between 1973 and 1988, the teen pregnancy rate for girls aged 14 or younger decreased 24 percent between 1988 and 1996 to the lowest rate ever recorded. Note: denominator used is the population of girls aged 14. The Alan Guttmacher Institute. (1999). Special report: U.S. teenage pregnancy statistics with comparative statistics for women aged 20-24. New York: Author. Link:The Alan Guttmacher Institute: Home Page
Teen Pregnancy Rates, Girls Under 15 (NCHS)(number of pregnancies per 1,000 girls) 16 After increasing 16 percent between 1982 and 1985 and remaining constant between 1985 and 1986, the teen pregnancy rate for girls aged 14 or younger decreased 22 percent between 1986 and 1996 to the lowest rate ever recorded. Note: denominator used is the population of girls aged 10-14. Ventura, S.J., Mosher, W.D., Curtin, S.C., Abma, J.C., & Henshaw, S. (2000). Trends in pregnancies and pregnancy rates by outcome: Estimates for the United States, 1976-96. Vital and Health Statistics 21(56). Link:The Alan Guttmacher Institute: Home Page
17 Teen Pregnancy Rates, Girls Under 15 (NCCDPHP)(number of pregnancies per 1,000 girls) The teen pregnancy rate for girls aged 14 or younger decreased 11 percent between 1995 and 1997. Note: denominator used is the population of girls aged 13-14. Centers for Disease Control and Prevention. (2000). National and state-specific pregnancy rates among adolescents – United States, 1995-1997. MMWR, 49(27), 605-11. Link:The Alan Guttmacher Institute: Home Page
Epidemiology in Action 18 Data Sources Teen pregnancy data are released by three national groups: • The Alan Guttmacher Institute • The National Center for Health Statistics (NCHS), Centers for Disease Control and Prevention (CDC), U.S. Department of Health and Human Services (DHHS) • The National Center for Chronic Disease Prevention and Health Promotion (NCCDPHP) Each group collects different information, from different sources, in different ways. These three groups DO tend to operate very similarly, thus the similarity of their results. Other studies, however, will have marked differences in terms of collection and presentation of data, and it can affect things significantly. Link:The Alan Guttmacher Institute: Home Page Link:National Center for Health Statistics Link:National Center for Chronic Disease Prevention
19 • How data is gathered, • by whom, and • how it is analyzed are all factors that can introduce BIAS into research. Library of Congress 1908 Sioux Indian smoking Do we look at research by cigarette manufacturers on the health dangers of smoking, for example, the same as research done by an independent, unbiased organization? We’re BIASED when we play favorites in terms of choosing study subjects or in assessing exposure. Bias is dangerous, because it can invalidate a study.
20 For example, how could a researcher make the US statistics look even worse? International Pregnancy Rates, Teens 15-19 (AGI) The United States has much higher pregnancy and birth rates than other fully industrialized countries. U.S. pregnancy rates are nearly twice as high as rates in Canada and England and seven to eight times as high as rates in Japan and the Netherlands. Singh, S., & Darroch, J.E. (2000). Adolescent pregnancy and childbearing: Levels and trends in developed countries. Family Planning Perspectives 32(1), 14-23. Pregnancy rates calculated as the sum of births, abortions, and estimated miscarriages (20 percent of births plus 10 percent of miscarriages).
21 By only presenting data on 4 countries, that’s how. (Granted, it’s bad, but is it that bad?)
Epidemiology in Action 22 This is an example of BIAS, and it happens all the time when politicians, advertisers, and other organizations organize their statistics in ways that best persuade, no matter what the real “truth” is. When conducting solid research, we want to reach what’s called the “true” value – the pure statistics, untainted by bias. For an interesting look at how mangled research can get when bias is allowed to reign, check out STATS, a non-partisan, non-profit research organization in Washington, D.C. devoted to the accurate use of scientific and social research in public policy debate. In their “news clips” section, for example, you’ll see articles such as “Good News! More People are Reporting Crimes!,” that tell the real story behind the faulty use of statistics. LINK:Statistical Assessment Service (STATS) Source: Statistical Assessment Service 2100 L. St. NW Suite 300 Washington, D.C. 20037
Epidemiology in Action 23 • Problems to watch out for in epidemiological studies: • Selection Bias – when subjects chosen are not representative of the target population about which conclusions are to be drawn. • Information Bias – errors in measuring exposure/risk or disease/condition • Confounding Variable – A variable that is related to the condition/disease under study and is associated with, but NOT a consequence of, the exposure/risk factor under investigation.
STUDENT ASSIGNMENT: STUDY THE STATS 24 DIRECTIONS:In groups of two or three, students are to find two sets of data done on a similar population, from two different sources. Use any of the sources we’ve been introduced to so far as starting points, or find your own sources. Suggested study health topics include: Cancer, smoking, drugs/alcohol, teen violence, health/nutrition issues, etc. Then….. find out how both studies got their information – how was it collected? When was it collected? Who collected it? What instruments (such as a survey) did they use to collect information? How did they analyze and present their data? Compare/contrast the two studies, in terms of the Who/What/When/Where/How. • Determine how the studies DIFFERED in terms of what they measured (age/time/risk factors/etc.) • Decide how the researchers may have introduced BIAS into their research, and discuss possible CONFOUNDING variables that may be affecting results. Give at least three examples of places where BIAS could be lurking in this study, and two examples of potential CONFOUNDING variables that may call the results into question. • Present your findings to the class in a written report, a PowerPoint presentation, or both.
25 STUDENT ASSIGNMENT: STUDY THE STATS Suggested GENERAL Resources: Link:National Center for Health Statistics Link:National Center for Chronic Disease Prevention Link:NIH: Health Information Link:National Center for Educational Statistics Link:Census Bureau Home Page OTHER Resources: • Try searching by topic for research statistics. For example: • Teen smoking research statistics • Cancer research statistics • Juvenile crime research statistics • Teen driving research statistics
Epidemiology in Action 26 • Observational Studies: Analytic • Three types of ANALYTIC studies: • Cohort • Case-Control • Cross-sectional
COHORT Studies • compare groups of people who have been exposed to suspected risk factors to groups of people who have not been exposed to determine who develops a disease or other outcome. • For example, an ongoing study of nuns has found a link between low language skills and development of Alzheimer’s disease in later life. In this study: Epidemiology in Action 27 Exposure Disease, y/n ? Link:The Nun Study Also See: How to Investigate an Outbreakfor excellent lesson on cohort studies
Epidemiology in Action 28 • COHORT Studies • Summary of the Nun Study on Linguistic Ability: Summary:The Nun Study indicates that low linguistic ability in early life has a strong association with dementia and premature death in old age. Researchers investigated the relationship of linguistic ability in early life to the neuropathology of Alzheimer’s disease and cerebrovascular disease. They analyzed 74 Nun Study participants’ handwritten autobiographies, written between ages 19 – 37. Idea density of the journals was measured, and after death their brains were autopsied and investigated for evidence of Alzheimer’s disease pathology in the neocortex. Low idea density scores from early life were associated with the severity of Alzheimer’s disease at the time of death. Source: : Linguistic ability in early life and the neuropathology of Alzheimer's disease and cerebrovascular disease: Findings from the Nun Study In: Vascular factors in Alzheimer's disease, Volume 903, Kalaria RN, Ince P, eds., pp. 34-38, New York: New York Academy of Scicences, 2000. Link:The Nun Study Note: This site is filled with interesting statistics, study abstracts, and other materials on a wide variety of risk factors. Examples of more advanced statistical analyses than those covered in this curriculum are in plentiful supply, and easily accessible to students.
Epidemiology in Action 29 • COHORT • Advantages • Exposure precedes health outcome, necessary to infer causation • Less subject to bias because exposure is evaluated before health outcome is known • Can examine multiple health results to exposure • Disadvantages • Expensive, time consuming • Can infer cause, not prove • Not as useful when the total population at risk is not well-defined
Epidemiology in Action 30 • CASE CONTROL Studies • compare people with a condition (cases) to a people without the condition (controls) to study risk factors. For example, the first studies that pointed out the strong connection between smoking and lung cancer were Case-Control Studies. Source: CDC/ gross pathology of lung from smoking This link describes some interesting current studies on teens and smoking: Epidemiology of Youth Drug Abuse - Research Findings 2/00
CASE CONTROL Studies • compare people with a condition (cases) to people without the condition (controls) to study risk factors. Epidemiology in Action 31 Smoking and Carcinoma of the Lung Doll R. Bradford, Hill A. Smoking and carcinoma of the lung: preliminary report. British Medical Journal 1950, 2: 739-748.
CASE CONTROL Studies • Advantages • Can study rare health outcomes quickly/less expensively • Can study multiple exposures for a single outcome • Good for cases where the total population at risk is not well defined • Easier to conduct • Disadvantages • Greater potential for bias because of smaller sample size and because selection is done after risk and outcome have occurred Epidemiology in Action 32
Epidemiology in Action 33 • CROSS-SECTIONAL Studies • compare current health and exposure status of groups AT THE SAME TIME. • Uses a large sample so that inferences can be made regarding the whole population For example, survey a large number of college students in terms of heavy alcohol consumption, a risk factor. (Exposure/Non-exposure). Also survey how many students in the Exposed/Not Exposed populations are suffering from a stomach complaint, and compare the rates. Links to recent studies on college-age youth and alcohol use: Research Matters: College Alcohol Study Boozing, "binge" drinking, and violence among college students over time: Dr. Ruth Engs
34 CROSS-SECTIONAL Studies The PROPORTION of heavy drinkers with a stomach ailment at the time of the study is higher than the proportion of not-heavy drinkers. PROPORTION reporting stomach ailment
Epidemiology in Action 35 • CROSS-SECTIONAL • Advantages • Easy to conduct because you don’t have to wait for outcome to occur • Good for examining relationship between a risk factor and outcome • Disadvantages • A cause can’t be inferred because only current health and exposure are being studied • Not good for conditions that are long-term
Epidemiology in Action 36 Student Assignment: Your worksheet provides descriptions of a number of studies. In groups of two or three, based on what you’ve learned about types of studies, classify each study according to type, discuss advantages and disadvantages of each, and describe a hypothetical study that could be done that would be suited to this study design. Name That Study
37 FOR EXAMPLE: Name That Study CDC/Dr. Demetri Vacalis 1999 line graph • Decide if this study can be best categorized as EXPERIMENTAL, DESCRIPTIVE, COHORT, CASE-CONTROL, CROSS-SECTIONAL, or a combination. • Defend your choice with two reasons. • How is this design an ADVANTAGE/DISADVANTAGE in a study of THIS population? • What would be a hypothetical study you could do on a population, that would be suited to this type of study design? Explain WHY this design would be best for this type of study.
38 Link/Source:NCADI: The National Treatment Improvement Evaluation Study (NTIES) - Changes in Physical & Mental Health Another EXAMPLE: Name That Study • Decide if this study can be best categorized as EXPERIMENTAL, DESCRIPTIVE, COHORT, CASE-CONTROL, CROSS-SECTIONAL, or a combination. • Defend your choice with two reasons. • How is this design an ADVANTAGE/DISADVANTAGE in a study of THIS population? • What would be a hypothetical study you could do on a population, that would be suited to this type of study design? Explain WHY this design would be best for this type of study.