Download
1 / 31
320 likes | 672 Views
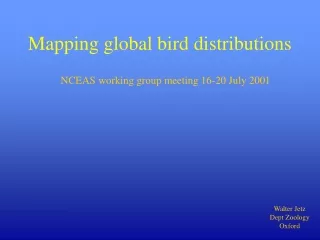
Mapping global bird distributions. NCEAS working group meeting 16-20 July 2001. Walter Jetz Dept Zoology Oxford. Large-scale conservation priority setting (refining the hotspot approach with species distributions) Rapid assessment of diversity in regions under threat

E N D
Mapping global bird distributions NCEAS working group meeting 16-20 July 2001 Walter Jetz Dept Zoology Oxford
Large-scale conservation priority setting (refining the hotspot approach with species distributions) Rapid assessment of diversity in regions under threat Coarse-resolution basis for deductive modelling of species’ fine-scale distributions Scrutiny of hypothesis in large-scale ecology Benefits Why a free, public global vertebrate distribution database would be valuable Mapping Global Vertebrate Distributions Walter Jetz, University of Oxford
General GOs and NGOs • tool for resource and land management • General Public • custom species lists for home region or eco-tourism destinations • Private Sector Land-use • information tool for land development projects, impact assessments Beneficiaries • Conservation NGOs • prioritise conservation efforts • taxonomically: range size as measure of extinction risk • geographically: refining hotspots using species data • Museums • identify holes in distribution and gaps of specimen records • prioritise areas for fieldwork • link morphological data and biogeographic perspective • Academia • identify determinants of patterns in species richness • detect mechanisms and environmental correlates of speciation • understand environmental determinants of biological patterns Mapping Global Vertebrate Distributions Walter Jetz, University of Oxford
Conservation NGOs • ground network of expertise • source and gap identification • facilitation of digitisation and gap filling • Museums • taxonomic expertise • source identification and selection • specimen records • Academia • methodological expertise • source selection and prioritisation • GIS tools Joint Effort Working Group meetings at (and funded by) National Centre for Ecological Analysis and Synthesis, University of Santa Barbara Mapping Global Vertebrate Distributions Walter Jetz, University of Oxford
Birds (Sibley) Passerines (Passeriformes): 5879 Nonpasserines (Non-Passeriformes): 4075 Mammals(Wilson & Reeder 1993) Platypus, Echidnas (Monotremata): 3 Oppossums, Kangaroos etc. (Marsupalia): 273 Placental Mammals (Eutheria): 4353-78 (whales) Amphibians (Duellman & Trueb 1986) Frogs and Toads (Salientia): 3438 Salamanders and Newts (Caudata): 352 Caecilians (Gymnophiona): 162 Reptiles (Uetz) Lizards (Sauria): 4582 Snakes (Serpentes): 2910 Turtles (Testudines): 296 Crocodiles (Crocodylia): 23 Amphisbaenians (Amphisbaenia): 158 Tuataras (Rhynchocephalia): 2 Diversity of Terrestrial Vertebrates 9954 4275 3952 7971 -------- 26152 Mapping Global Vertebrate Distributions Walter Jetz, University of Oxford
Birds regional databases 9954 species in 176 families State of country- and continent-wide mapping efforts for bird distributions. Dark green: advanced, light green: weak Mapping Global Vertebrate Distributions Walter Jetz, University of Oxford
Identify key sources Regional atlas projects Sources Meta-data collections Congo Peacock Regional species lists Species accounts Museum specimen Square-tailed Kite Experts’ opinion Mapping Global Vertebrate Distributions Walter Jetz, University of Oxford
Not covered Gridded databases Nonpasserines not covered Australia Passerines Other Europe & not covered Mono- Africa graphs Handbook of the Birds of the World America Birds the knowledge base I. Major regional atlases (proportion of 9954 bird species) II. Major monographs (proportion of 176 bird families) Mapping Global Vertebrate Distributions Walter Jetz, University of Oxford
Inter-relationship of Source Types Gaps Geographically organised sources Taxonomically organised sources Distributions • Atlases • Regional databases • Regional monographs • Regional specimen collections • etc. ... • Monographs • Specimen Collections • etc. ... source overlap Sources organised by extinction risk • IUCN Red List data • Conservation NGO data and distribution maps
Example: Bird Distributions in Asia Gaps Geographically organised sources Taxonomically organised sources Distributions • HBW - Nonpasserines • Thrushes of the World • Finches and Sparrows of the World • Old World Warblers • etc. ... • The Birds of China • Birds of the Indian Subcontinent • Birds of Japan • etc. ... source overlap Sources organised by extinction risk • Threatened Birds of the World • Regional threatened species databases
Birds: 9,954 species Taxonomically organised sources Geographically organised sources • I. • ABI-CABS Birds of the Americas Databasepartial ranges for ca. 3,680 species • Atlas of Birds of Australiapartial ranges for ca. 1,030 species • Atlas of Birds of Europepartial ranges for ca. 430 species • Birds of Oceanic islands, from WWF eco-regions and other sourcespartial ranges for ca. 450 species • I. • Handbook of the Birds of the World • full ranges for 3,666 species Full Distributions I. 8,200 species III. Various family monographs II. 9,450 species III. 9,954 species • II. • Birds of the Western Palearcticfull ranges for ca. 520 species • Birds of China • Keith et al: Birds of Africa, Atlases from Southern Africa, Tanzania, Kenia, Somalia, Liberia, etc. …partial ranges for ca. 2000 species Sources organised by extinction risk I. Birdlife: Threatened Birds of the World full ranges for 1,189 species • III. • Various regional sources and species lists. III. Birdlife: Endemic Bird Areas for Orientalis, Wallacea * listed are potential sources pending agreement with authors/publishers
Gridded, fixed resolution Hierarchical Decision Rule S4 > S3 > S2 > S1 • Climate and vegetation layers, remotely sensed • Species habitat preference information Concatenated, original resolution confirmed fine scale presence and absence,extent of occurrence maps for biogeographic validation Modelled (inductive and deductive) species distribution How to map a species’ range from a variety of sources? Overlaying disparate sources Source 3 Regional Atlas Source 4 Point Data Source 1 HBW Source 2 Regional Monograph
Range of potential sources Evaluate sources for quality, accessibility and complementarity Identify available sources Selected sources Identify most efficient method of digitisation Multitude of regional and taxonomic databases of different resolution and quality Queried database Devise hierarchical algorithm for query where sources overlap Digitise General Methodology Mapping Global Vertebrate Distributions Walter Jetz, University of Oxford
Data Reality Taxonomies will always differ somehow by expert and region Various initiatives: ISIS, Species2000…. BCIS Taxonomies • Master Taxonomies ? • Herps: Master Taxonomies? • Mammals: Wilson & Reeder • Birds: Sibley & Ahlquist • Solution …? • Create database of all potential taxonomies (or ask data provider to provide) • Link all taxonomies to master taxonomy
Source Types - Problems • Extent of occurrence maps • poor temporal and spatial resolution • wide coverage • Frame/size of maps printed in books does not scale with extent of range • potentially high spatial error • size of error should be directly related to map scale, can perhaps be incorporated in modelling • inter- and extrapolated in unstandardised way, false presences • great resource for range modelling together with point data • Atlas Data • good temporal resolution • geographically limited • differences in observer effort, holes in distribution, false absences • Point Data: specimen, community studies, observations • perfect temporal and spatial resolution • coverage scattered, patchy, biased • great basis for ranges modelling using remotely sensed data and extent of occurrence maps for biogeographic component
Towards a standardised source database • Source types: • Published or expert-based extent of occurrence maps, atlas data, gridded databases, regional or local community studies, point localities (observations and specimen) Fields to include: • Usual reference information (author, year, title, journal/publisher) • Extent: temporal, taxonomic, geographic (description), spatial object • Procedural information: processes undertaken, dates, people behind • Evaluation: • spatial resolution • quality: correct species identification • quality: spatial error data • quality: spatial error digitisation • Notes: Similar sources
Time Efficient Data Entry Streamlining the digitisation process Square-tailed Kite White-collared Kite Mapping Global Vertebrate Distributions Walter Jetz, University of Oxford
Global Patterns of Diversity in Diurnal Raptors Ranges of year-round residents, min=1 to max=70 species Data from Handbook of the Birds of the World, resampled to 200km grid Mapping Global Vertebrate Distributions Walter Jetz, University of Oxford
New World Passerines Species Richness natural breaks, min=1, max=332 Geom. Mean of Range Sizes natural breaks, min=12990km2, max=13642403km2 Collaboration with Lisa Manne and Stuart Pimm. Mapping Global Vertebrate Distributions Walter Jetz, University of Oxford
Energy availability Habitat Heterogeneity Evolutionary Time Biome area Geometric constraints Determinants of species richness- Hypotheses - Plethora of hypotheses Lessons so far • one single factor ??? • many studies to date: • limited to one specific hypothesis/variable • limited to small region, taxonomic sub-sample • limited to one dimension (e.g. latitude) • excluding the tropics
Species richness pattern All species (n=1902), continental Africa Natural breaks classification, 2-615 species per quadrat Collaboration with Carsten Rahbek.
Productivity & Habitat Heterogeneity NDVI mean of all ten-day images (1982-99) • remotely sensed from AVHHR satellites at 7.6km resolution • NDVI (normalised difference vegetation index) is measure of greenness of vegetation, often used for vegetation classification • NDVI is synthesis of climatic condition that regulate productivity
Productivity & Habitat Heterogeneityspatial pattern, observed vs. predicted observed predicted (NPP, NPP2, HabHet) Natural breaks classification, left 3-558 species per quadrat, right 28-371
Productivity & Habitat Heterogeneityspatial pattern of residuals cyan: - white: 0 red: + Residual from model NPP+NPP2+HabHet Standard deviation classification, <-3 to >+3s.d.; left -8.962 to 8.612 ; right -214 to 262
Past climate events and their potential regional significance difficult to reconcile Species data as proxy Assumption: Regions with restricted range species (Centers of Endemism) have distinct evolutionary history Prediction: species richness in such defined regions with distinct evolutionary history is likely to be higher than in surrounding regions much less well predicted from contemporary environmental variables A signature of history?
The signature of historyobserved and predicted species richness in and outside Centers of Endemism (CoE) Observed species richness Residual from model NPP+NPP2+HabHet Centers of endemism: quadrats with species that have <= 10 quadrats range size Natural breaks classification 3-558 species per quadrat Standard deviation classification <-3 to >+3s.d., -214 to 262 species
The signature of historyobserved and predicted species richness in and outside Centers of Endemism (CoE)
Phylogeography Environmental change and rates of evolution: the phylogeographic pattern within the hartebeest complex as related to climatic variation Flagstad et al. Proc. R. Soc Lond. B (2001) 268, 667-677 Mapping Global Vertebrate Distributions Walter Jetz, University of Oxford
One-off database, downloadable from the internet Continuously updated, peer supervised internet based database embedded in a multi-level access, graphical web-portal with facilities for down- and uploading data etc. ... The ‘End’ Product? Source, species, lat, lon 17,1245,45,42 17, 1245,45,43 17, 1245,45,41 17, 1245,44,43 17, 1245,43,43 17, 1245,43,42 17, 1246,02,22 17, 1246,02,22 17, 1246,03,20 17, 1246,03,19 ……………… Mapping Global Vertebrate Distributions Walter Jetz, University of Oxford
Mapping Global Vertebrate Distributions Walter Jetz, University of Oxford