Download
1 / 5
0 likes | 8 Views
The publication is a summary of economic issues

E N D
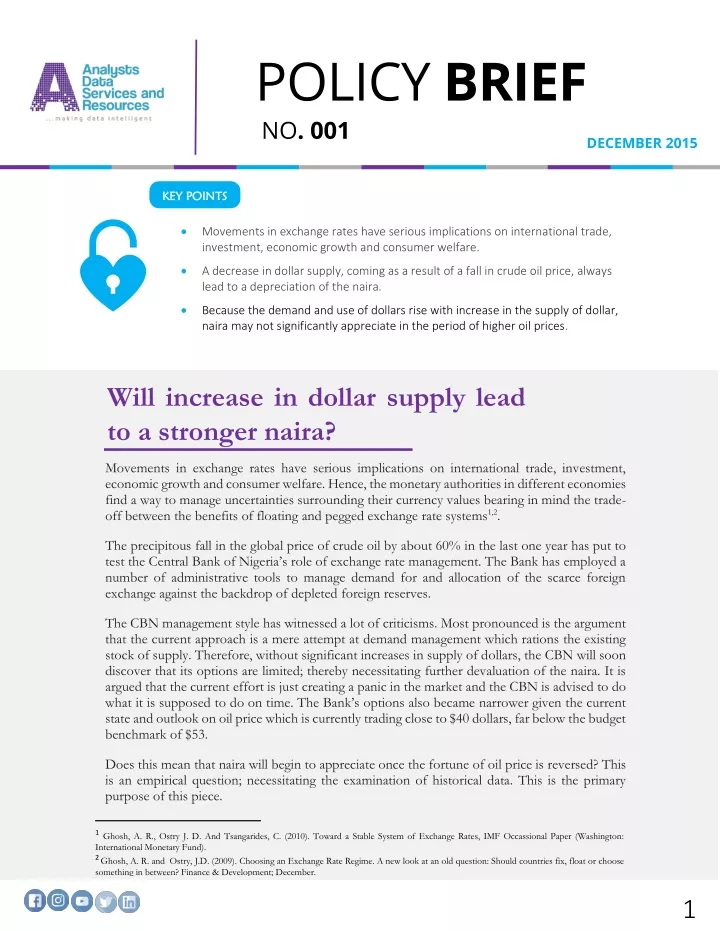
POLICY BRIEF NO. 001 DECEMBER 2015 KEY POINTS KEY POINTS • Movements in exchange rates have serious implications on international trade, investment, economic growth and consumer welfare. • A decrease in dollar supply, coming as a result of a fall in crude oil price, always lead to a depreciation of the naira. • Because the demand and use of dollars rise with increase in the supply of dollar, naira may not significantly appreciate in the period of higher oil prices. Will increase in dollar supply lead to a stronger naira? Movements in exchange rates have serious implications on international trade, investment, economic growth and consumer welfare. Hence, the monetary authorities in different economies find a way to manage uncertainties surrounding their currency values bearing in mind the trade- off between the benefits of floating and pegged exchange rate systems1,2. The precipitous fall in the global price of crude oil by about 60% in the last one year has put to test the Central Bank of Nigeria’s role of exchange rate management. The Bank has employed a number of administrative tools to manage demand for and allocation of the scarce foreign exchange against the backdrop of depleted foreign reserves. The CBN management style has witnessed a lot of criticisms. Most pronounced is the argument that the current approach is a mere attempt at demand management which rations the existing stock of supply. Therefore, without significant increases in supply of dollars, the CBN will soon discover that its options are limited; thereby necessitating further devaluation of the naira. It is argued that the current effort is just creating a panic in the market and the CBN is advised to do what it is supposed to do on time. The Bank’s options also became narrower given the current state and outlook on oil price which is currently trading close to $40 dollars, far below the budget benchmark of $53. Does this mean that naira will begin to appreciate once the fortune of oil price is reversed? This is an empirical question; necessitating the examination of historical data. This is the primary purpose of this piece. 1Ghosh, A. R., Ostry J. D. And Tsangarides, C. (2010). Toward a Stable System of Exchange Rates, IMF Occassional Paper (Washington: International Monetary Fund). 2 Ghosh, A. R. and Ostry, J.D. (2009). Choosing an Exchange Rate Regime. A new look at an old question: Should countries fix, float or choose something in between? Finance & Development; December. 1
Will increase in dollar supply lead to a stronger naira? ADSR Policy Brief No. 001 Stylized Facts Stylized Facts 70,000.00 180.00 160.00 60,000.00 140.00 In order to present a long-term view of the data, yearly data from 1970 to 2014 was used. Figure (a) depicts that a rising oil price in the period 1970 to 1980 co-existed with a relatively stable exchange rate. Oil price display a falling trend thereafter up to 1998 with exchange rate rising (naira depreciating) over that period. Between 1999 and 2008 when oil price rose from $15.39/b to $108.46/b, naira however depreciated from N92.69/$ to N118.57/$ with a higher value of N133.5/$ in 2004. The sharp fall in oil price in the period 2009-2010 led to a proportional depreciation in naira to N150.3/$. The subsequent recovery of oil price up to 2013 was however accompanied by gradual depreciation of the naira. 50,000.00 120.00 40,000.00 100.00 80.00 30,000.00 60.00 20,000.00 40.00 10,000.00 20.00 - 0.00 2006 2010 1970 RES_$'M (LHS) EXR (RHS) 1972 1974 1976 1978 1980 1982 1984 1986 1988 1990 1992 1994 1996 1998 2000 2002 OIP_$'Barrel (RHS) 2004 2008 2012 2014 (a) Oil Price, Exchange Rate and Reserves 12,000,000.00 180.00 160.00 10,000,000.00 140.00 8,000,000.00 120.00 This evidence is mixed. First, it confirms the argument that a decrease in dollar supply, coming as a result of fall in crude oil price, always leads to a depreciation of the naira. The opposite that increases in dollar supply will lead to the appreciation of the naira however does not fully hold. These stylized facts show that increase in dollar supply will at best lead to a stable exchange rate system; and may sometimes co-exist with a fall in the value of the naira. This will depend on many other factors. 100.00 6,000,000.00 80.00 4,000,000.00 60.00 40.00 2,000,000.00 20.00 - 0.00 1976 2014 1970 IMP_N'M(LHS) 1972 1974 1978 1980 1982 1984 1986 1988 1990 1992 1994 1996 1998 2000 2002 OIP_$'Barrel (RHS) 2004 2006 2008 2010 2012 EXR (RHS) (b) Oil Price, Exchange Rate and Import 10,000,000.00 180.00 This asymmetric impact of oil price on exchange rate is further explained by plotting the trends of oil price and exchange rate against each of imports (figure b) and amount distributed to tiers of government (figure d). It is observed from the figures that imports and amounts distributed generally track the supply of dollar (changes in oil price). A period of sharp increase in oil price is also a period of sharp increase in both indicators. Although both may be reduced when oil prices fall, they are more responsive to an increase than a decrease in oil price. In other words, they are sticky downwards.1 9,000,000.00 160.00 8,000,000.00 140.00 7,000,000.00 120.00 6,000,000.00 100.00 5,000,000.00 80.00 4,000,000.00 60.00 3,000,000.00 40.00 2,000,000.00 20.00 1,000,000.00 - 0.00 1980 1994 2008 1970 1972 1974 1976 1978 1982 1984 1986 1988 1990 1992 1996 1998 2000 2002 2004 2006 2010 2012 2014 OILR_N'M (LHS) OIP_$'Barrel (RHS) (c) Oil Price, Exchange Rate and Oil Revenue 1Ghosh, A. R., Ostry J. D. And Tsangarides, C. (2010). Toward a Stable System of Exchange Rates, IMF Occassional Paper (Washington: International Monetary Fund). 2 Ghosh, A. R. and Ostry, J.D. (2009). Choosing an Exchange Rate Regime. A new look at an old question: Should countries fix, float or choose something in between? Finance & Development; December. 2
Will increase in dollar supply lead to a stronger naira? ADSR Policy Brief No. 001 120.00 8,000,000.00 180.00 R² = 0.9383 160.00 7,000,000.00 100.00 140.00 6,000,000.00 80.00 120.00 5,000,000.00 100.00 60.00 4,000,000.00 80.00 40.00 3,000,000.00 60.00 2,000,000.00 20.00 40.00 1,000,000.00 20.00 0.00 2009 1970 1973 1976 1979 1982 1985 1988 1991 1994 1997 2000 2003 2006 2012 - - 1997 1998 1999 2000 2001 2002 2003 2004 2005 2006 2007 2008 2009 2010 2011 2012 2013 2014 Amd_N'M (LHS) OIP_$'Barrel (RHS) Figure A-1: Trend Analysis of Crude Oil price for the period 1970- 2014 EXR (RHS) (d)Oil Price, Exchange Rate and Amount Distributed The table below depicts the descriptive statistics of the macroeconomic variables considered in the analysis. The table was classified into five episodes for references to policy implication in each episode. Policy Implications Policy Implications Because the demand and use of dollars rise with increase in the supply of dollar, naira may not significantly appreciate in the period of higher oil prices. This follows from the monetary approach to exchange rate determination that an expansionary foreign exchange operation is similar to an expansionary monetary operation in that both lead to increase in money supply. For the episode of 1970 – 1973, the oil price ranges from $1.90 per barrel to $2.83 per barrel with a mean and average annual growth rate of $2.13 per barrel and 16.37% respectively. Also, Exchange rate ranges from 0.66 to 0.71 with an average of 0.68 and average annual growth rate of - 2.68%. Moreso, this episode reveals that the reserves have a minimum value to $116.44 million and maximum value of $295.65million. Its mean value stood at $207.46 million with an average annual growth rate of 38.92%. Furthermore, the import ranges from ₦756.42 million to ₦1,224.80 million with a mean and average growth rate of ₦1,012.56 million and 19.37% respectively. Lastly, the value of oil revenue ranges from ₦166.60 million to ₦1,016.00 with a mean of ₦614.25 million and average growth rate of 96.32%. This explains why the monetisation of oil proceeds often lead to the depreciation of naira. It also underscores the argument that the monetary authority can only influence nominal exchange rate as real exchange rate is determined by real, not monetary factors. It is therefore important for the CBN to direct its exchange rate management towards stabilizing the domestic price level in the long run. Appendix Appendix During the episode of 1974 – 1982, the value of oil price ranges from $10.41 per barrel to $39.25 per barrel with the average value of $22.39 per barrel and the average annual growth rate of 47.12%. Also, the exchange rate ranges from 0.55 to 0.67 with the mean and average annual growth rate of 0.62 and 0.46% respectively. More so, the reserves range from $1,027.03million to $12,839.60million with a mean of $2,923.01million and average This section presents periodic summary statistics of the variables used in this study. First, five episodes were identified by fitting a polynomial line to the trend of exchange rate movements over the period 1970-2014. Summary statistics of the six variables used in this study are then presented in a table. 3
Will increase in dollar supply lead to a stronger naira? ADSR Policy Brief No. 001 annual growth rate of 68.68%. Furthermore, the country’s import has a minimum value of ₦1,737.30 million and maximum value of ₦12,839.60million with an average value of ₦7,343.43million and average annual growth rate of 37.01%. Also, oil revenue ranges from ₦3,724.00million and ₦12,353.30 million with an average value and average value annual average growth rate of ₦6,845.61million and 43.30% respectively. of 21.63%. Furthermore, the country’s import has a minimum value of ₦562,626.60million and maximum value of ₦10,235,174.22million with an average value of ₦2,930,141.61million and average annual growth rate of 39.99%. The value of oil revenue ranges from ₦324,311.20million and ₦8,879,000.00million with an average value and average value annual average growth rate of ₦2,980,507.17millionand 36.90% respectively. Lastly, the amount distributed has a minimum value of ₦208,000.00million and maximum value of ₦5,535,400.00million with a mean value of ₦2,572.593.74million and average annual growth rate 30.70%. The episode of 1983 – 1994 reveals that oil price ranges from $15.00 per barrel to $31.06 per barrel with the average value of 21.81 and the average annual growth rate of -3.84%. Also, the exchange rate ranges from 0.72 to 22.05 with the mean and average annual growth rate of 8.29 and 38.68% respectively. More so, the reserves range from $456.64million to $7,944.09million with a mean of $3,462.41million and average annual growth rate of 36.37%. Furthermore, the country’s import has a minimum value of ₦5,983.60million and maximum value of ₦165,629.40million with an average value of ₦58,839.28million and average annual growth rate of 35.56%. Lastly, the value of oil revenue ranges from ₦7,253.00million to ₦164,078.10million with a mean value and average annual growth rate of ₦62,789.07million and 37.01%. The episode for the period of 2012 – 2014, the value of oil price ranges from $100.35 per barrel to $117.70 per barrel with the average value of $109.68 per barrel and the average annual growth rate of -4.88%. Also, the exchange rate ranges from 157.31 to 158.53 with the mean and average annual growth rate of 157.78 and 1.01% respectively. More so, the reserves range from $32,580.28millionto $45,612.95millionwith a mean of $38,471.19million and average annual growth rate of 2.94%. Furthermore, the country’s import has a minimum value of ₦562,626.60million and maximum value of ₦10,235,174.22million with an average value of ₦2,930,141.61million and average annual growth rate of 39.99%. The value of oil revenue ranges from ₦8,808,102.61million and ₦8,879,000.00 million with an average value and average value annual average growth rate of ₦9,136,745 and 8.62% respectively. Lastly, the amount distributed has a minimum value of ₦5,676,000.00 million and maximum value of ₦7,174,520.00 million with a mean value of ₦6,434,473.33million and average annual growth rate 9.14%. During the episode of 1995 – 2011, the value of oil price ranges from $13.62 per barrel to $116.95 per barrel with the average value of $48.85 per barrel and the average annual growth rate of 15.95%. Also, the exchange rate ranges from 21.89 to 153.86 with the mean and average annual growth rate of 102.14 and 22.28% respectively. More so, the reserves range from $2,157.97million to $58,472.88million with a mean of $20,907.33million and average annual growth rate 4
Will increase in dollar supply lead to a stronger naira? ADSR Policy Brief No. 001 Table 1: Descriptive Analysis of Macroeconomic Variables OIP $'Barrel 1970-1973 Min 1.90 Max 2.83 Mean 2.13 AGR 16.37 1974-1982 Min 10.41 Max 39.25 Mean 22.39 AGR 47.12 1983-1994 Min 15.00 Max 31.06 Mean 21.81 AGR (3.84) 1995-2011 Min 13.62 Max 116.95 Mean 48.85 AGR 15.95 2012-2014 Min 100.35 Max 117.70 Mean 109.68 AGR (4.88) All Period Min 1.90 Max 117.70 Mean 36.25 AGR 15.54 Episodes EXR RES_$'M IMP_N'M OILR_N'M Amd_N'M 0.66 0.71 0.68 (2.68) 0.55 0.67 0.62 0.46 0.72 22.05 8.29 38.68 21.89 153.86 102.14 22.28 157.31 158.53 157.78 1.01 0.55 158.53 51.50 19.14 116.44 295.65 207.46 38.92 1,027.03 4,682.90 2,923.01 68.68 456.64 7,944.09 3,462.41 36.37 2,157.97 58,472.88 20,907.33 21.63 32,580.28 45,612.95 38,471.19 756.42 1,224.80 1,012.56 19.37 1,737.30 12,839.60 7,343.43 31.75 5,983.60 165,629.40 58,839.28 35.56 562,626.60 10,235,174.22 2,930,141.61 166.60 1,016.00 614.25 96.32 3,724.00 12,353.30 6,845.61 43.30 7,253.00 164,078.10 62,789.07 37.01 324,311.20 8,879,000.00 2,980,507.17 208,000.00 5,535,400.00 2,572,593.74 39.99 36.90 30.70 8,808,102.61 9,517,680.00 9,136,745.78 6,733,768.00 8,025,953.48 7,185,109.16 5,676,000.00 7,174,520.00 6,434,473.33 2.94 (2.08) 756.42 (8.62) 166.60 9.14 116.44 58,472.88 11,989.42 35.18 208,000.00 7,174,520.00 3,216,240.34 10,235,174.22 1,733,307.94 8,879,000.00 1,623,144.12 32.82 39.19 26.90 CONTACT +234 7037470047 info@adsrng.com, mail.adsr@gmail.com www.adsrng.com, www.adsranastat.com Analysts’ House, Opposite University of Ibadan 2nd Gate, Ibadan, Nigeria 5